Every number under control. Every future forecasted.
UpBooks FP&A centralizes budgets, forecasts, and actual results in one place. See how your business is doing against plans, spot differences quickly, and adjust. Whether you run one location or many, the app adapts to your structure and gives you clear reports and insights.

Certified Security
ISO 27001:2022 - IAF recognized
✓ CFO onboarding support included • ✓ Scenario modeling • ✓ Driver-based budgeting
Everything you need for financial planning
Eleven core capabilities that streamline your FP&A process
Dashboard
Single screen showing how your business is performing.
Business Plans
Create and manage budgets and forecasts with status tracking.
Create Business Plan
Step-by-step creation with Excel upload and flexible time periods.
Business Plan Detail
Detailed view of any plan with all line items and views.
Data Input
Upload real financial results via CSV with validated data.
Reports
Central place to access different financial reports.
Comparison Report
Side-by-side comparison of multiple plans with trends.
Variance Bridge
Visual breakdown of how numbers changed period to period.
Income Statement
Standard income statement with revenue, expenses, profit.
Trend Analysis
Charts showing how financial metrics change over time.
Performance Correlation
Shows how two metrics relate for data-driven decisions.
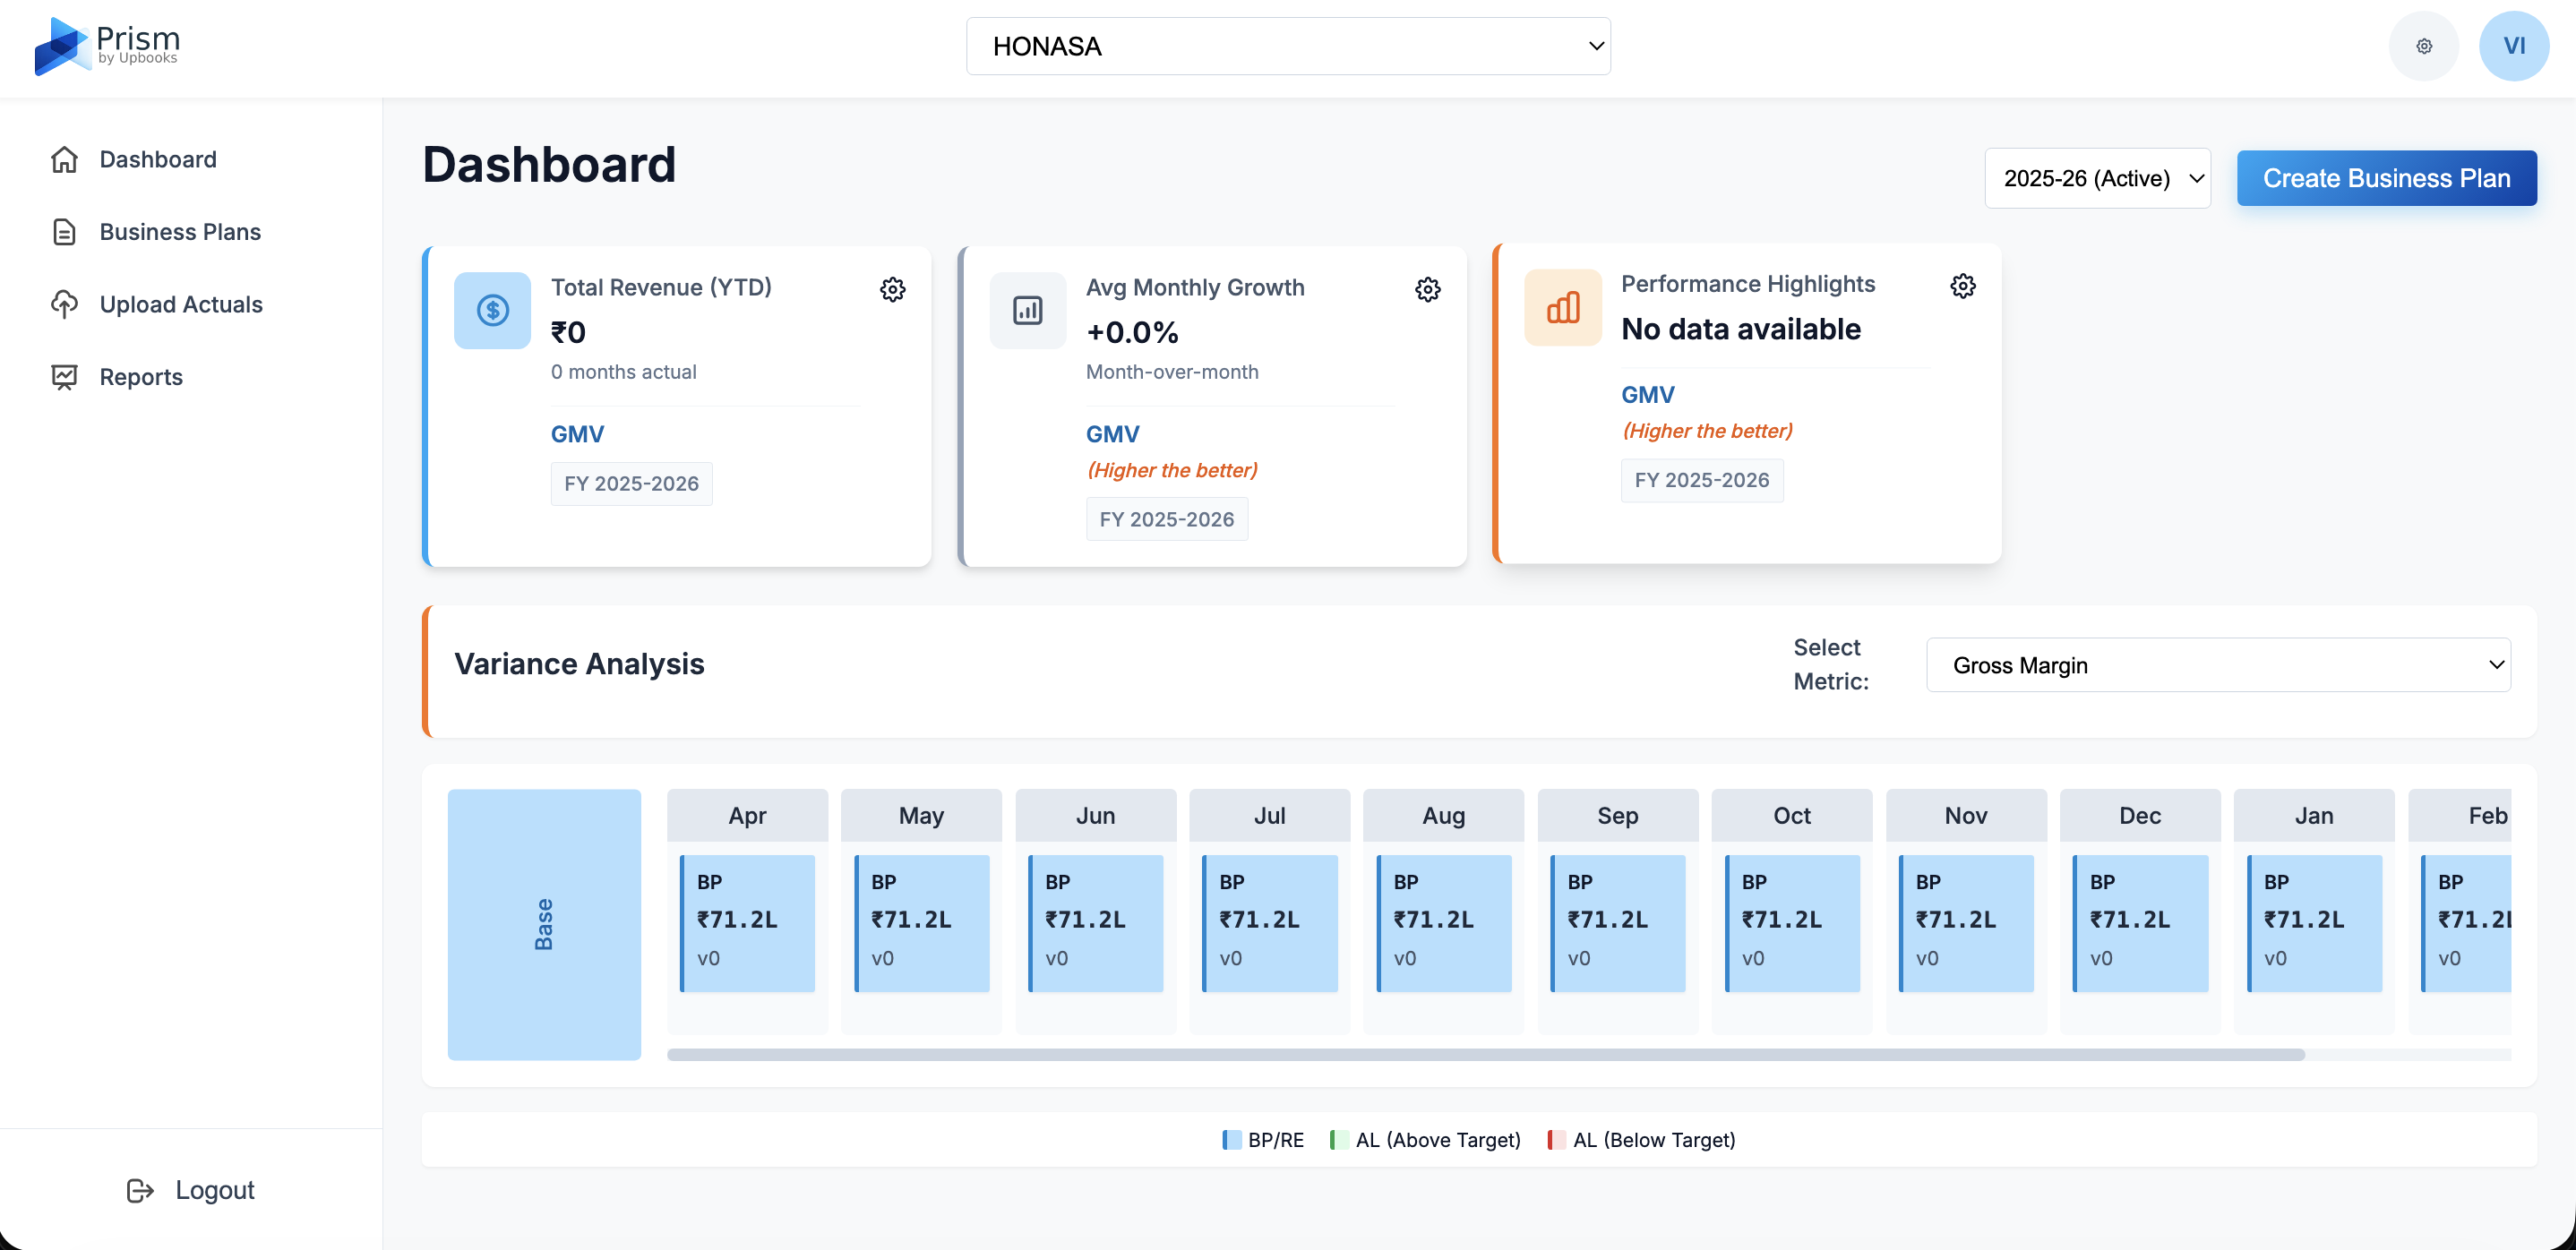
Dashboard
What it does: A single screen showing how your business is performing.
- Revenue overview – See total revenue for the year in one place
- Month-over-month growth – See whether performance is improving or declining over time
- Performance highlights – Quickly see which months are strongest and which need attention
- Plan vs actual tracking – See how each month compares to your targets (on track, above, or below)
- Switch years easily – Flip between financial years without leaving the page
- Multiple scenarios – View expected, optimistic, and pessimistic plan side by side
Benefits for your business
One place to see how your business is performing against plans with clear visibility into trends and scenarios.
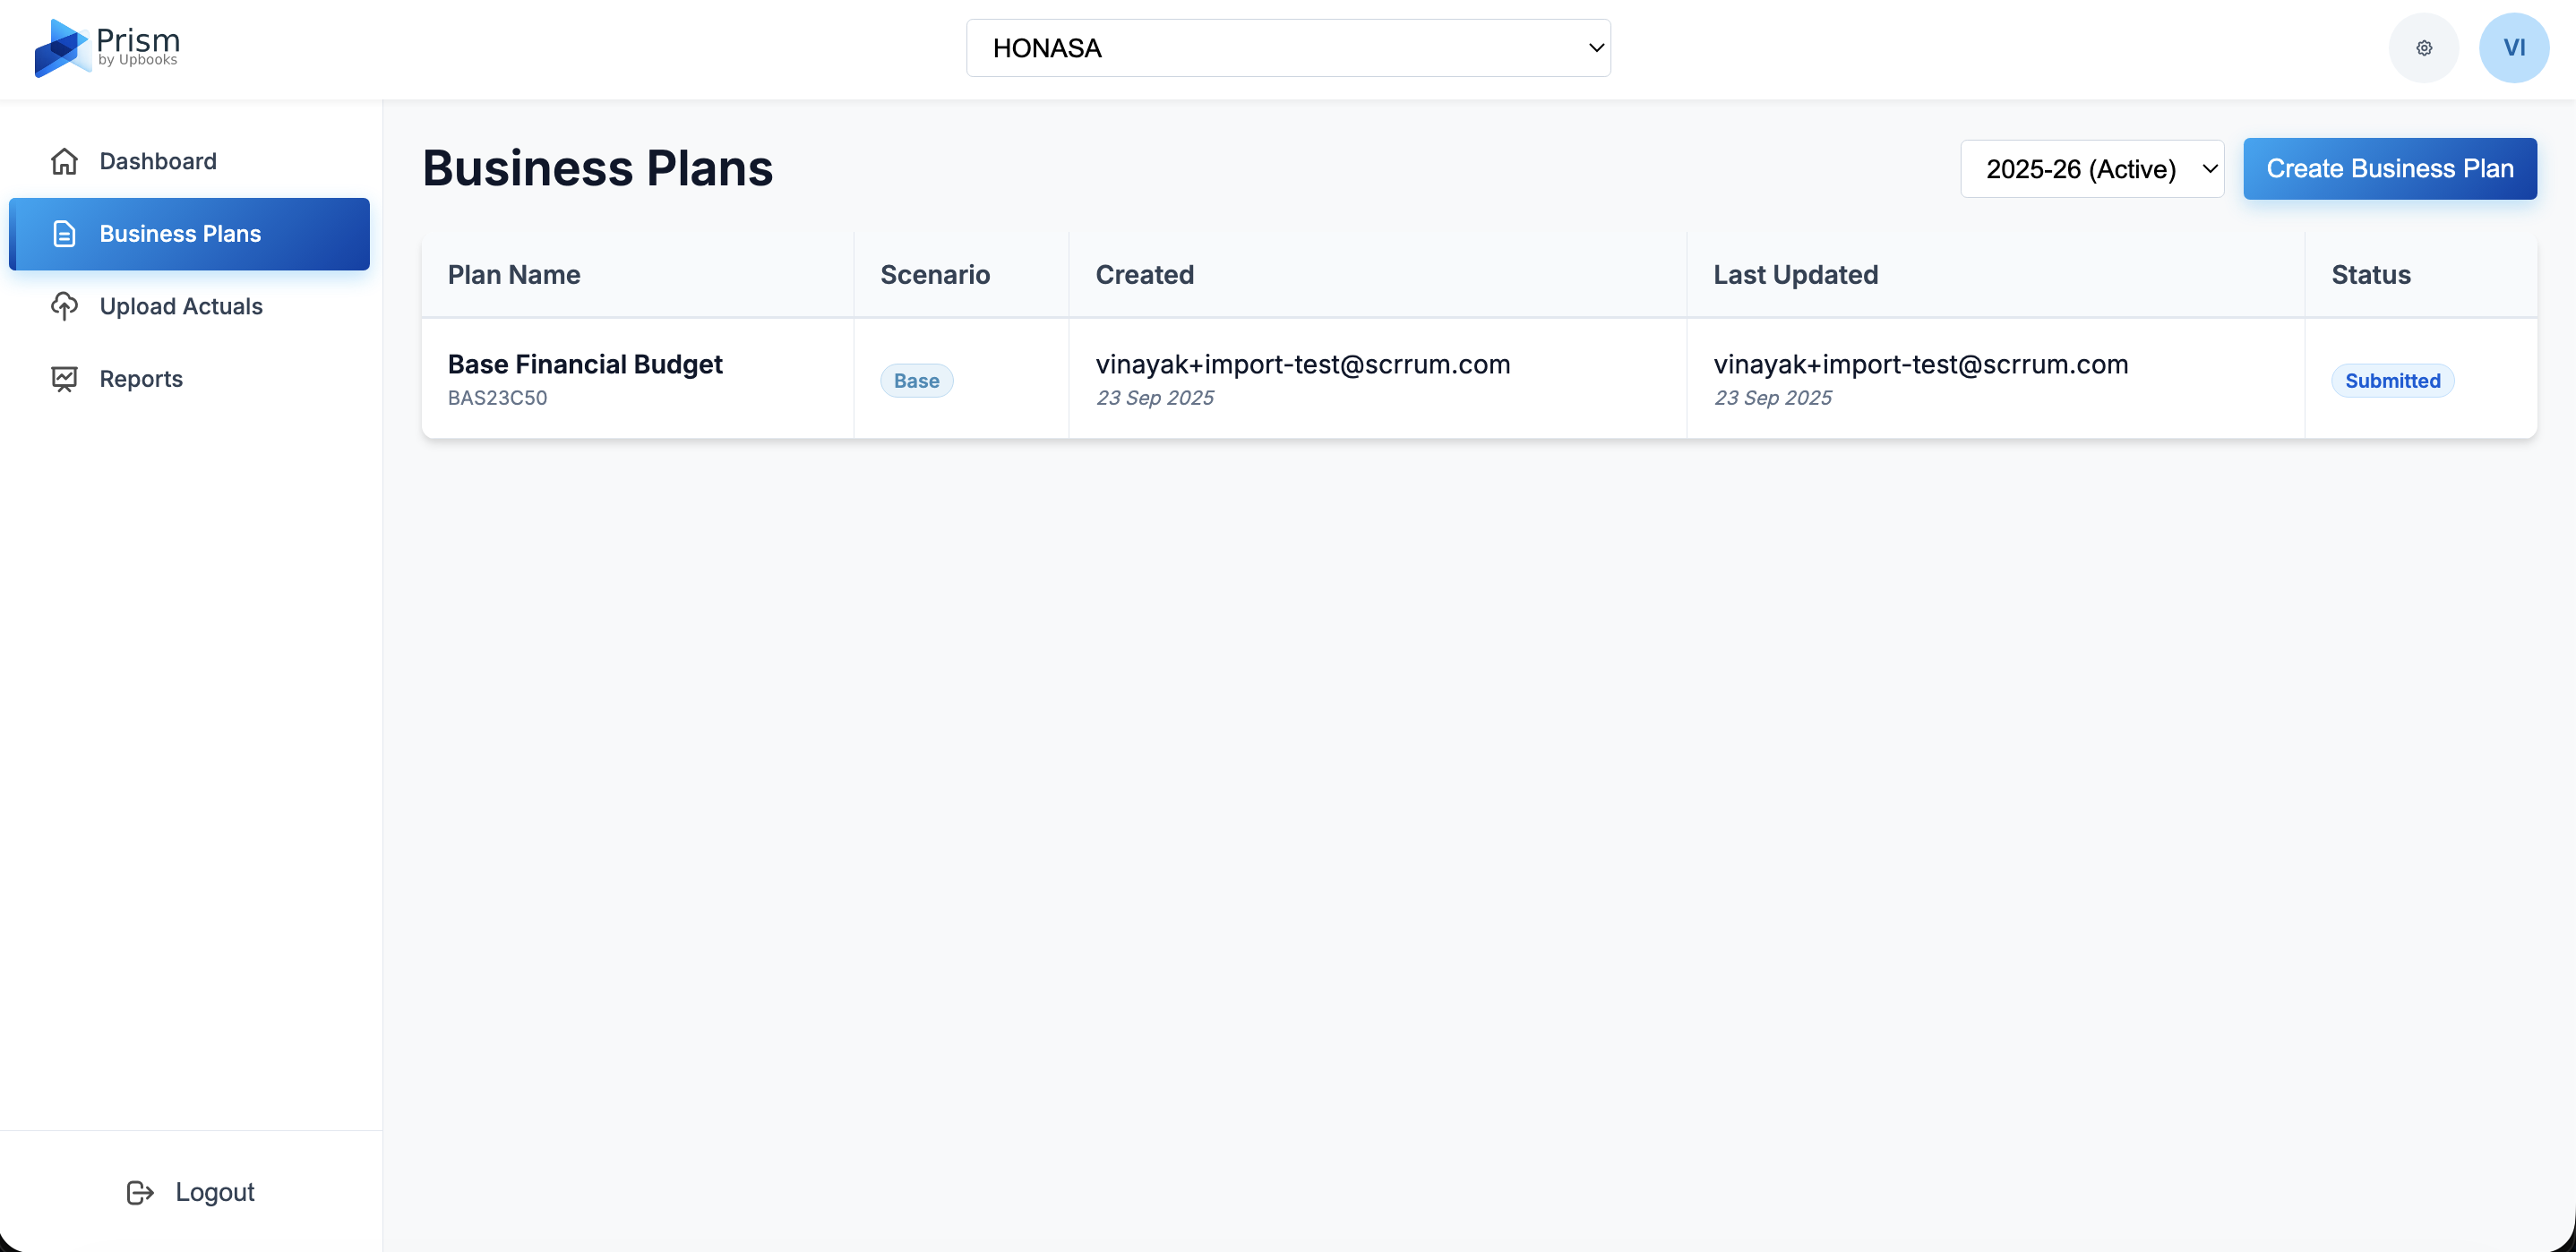
Business Plans
What it does: A place to create and manage your budgets and forecasts.
- One place for all plans – See all plans in a simple list with status and dates
- Full-year or monthly plans – Choose yearly, quarterly, or monthly planning
- Different scenarios – Plan for best case, worst case, and expected case
- Track progress – See who created and updated each plan and when
- Clear status – Know if a plan is draft, submitted, approved, or needs attention
Benefits for your business
Keeps everything organized and lets you see progress at a glance.
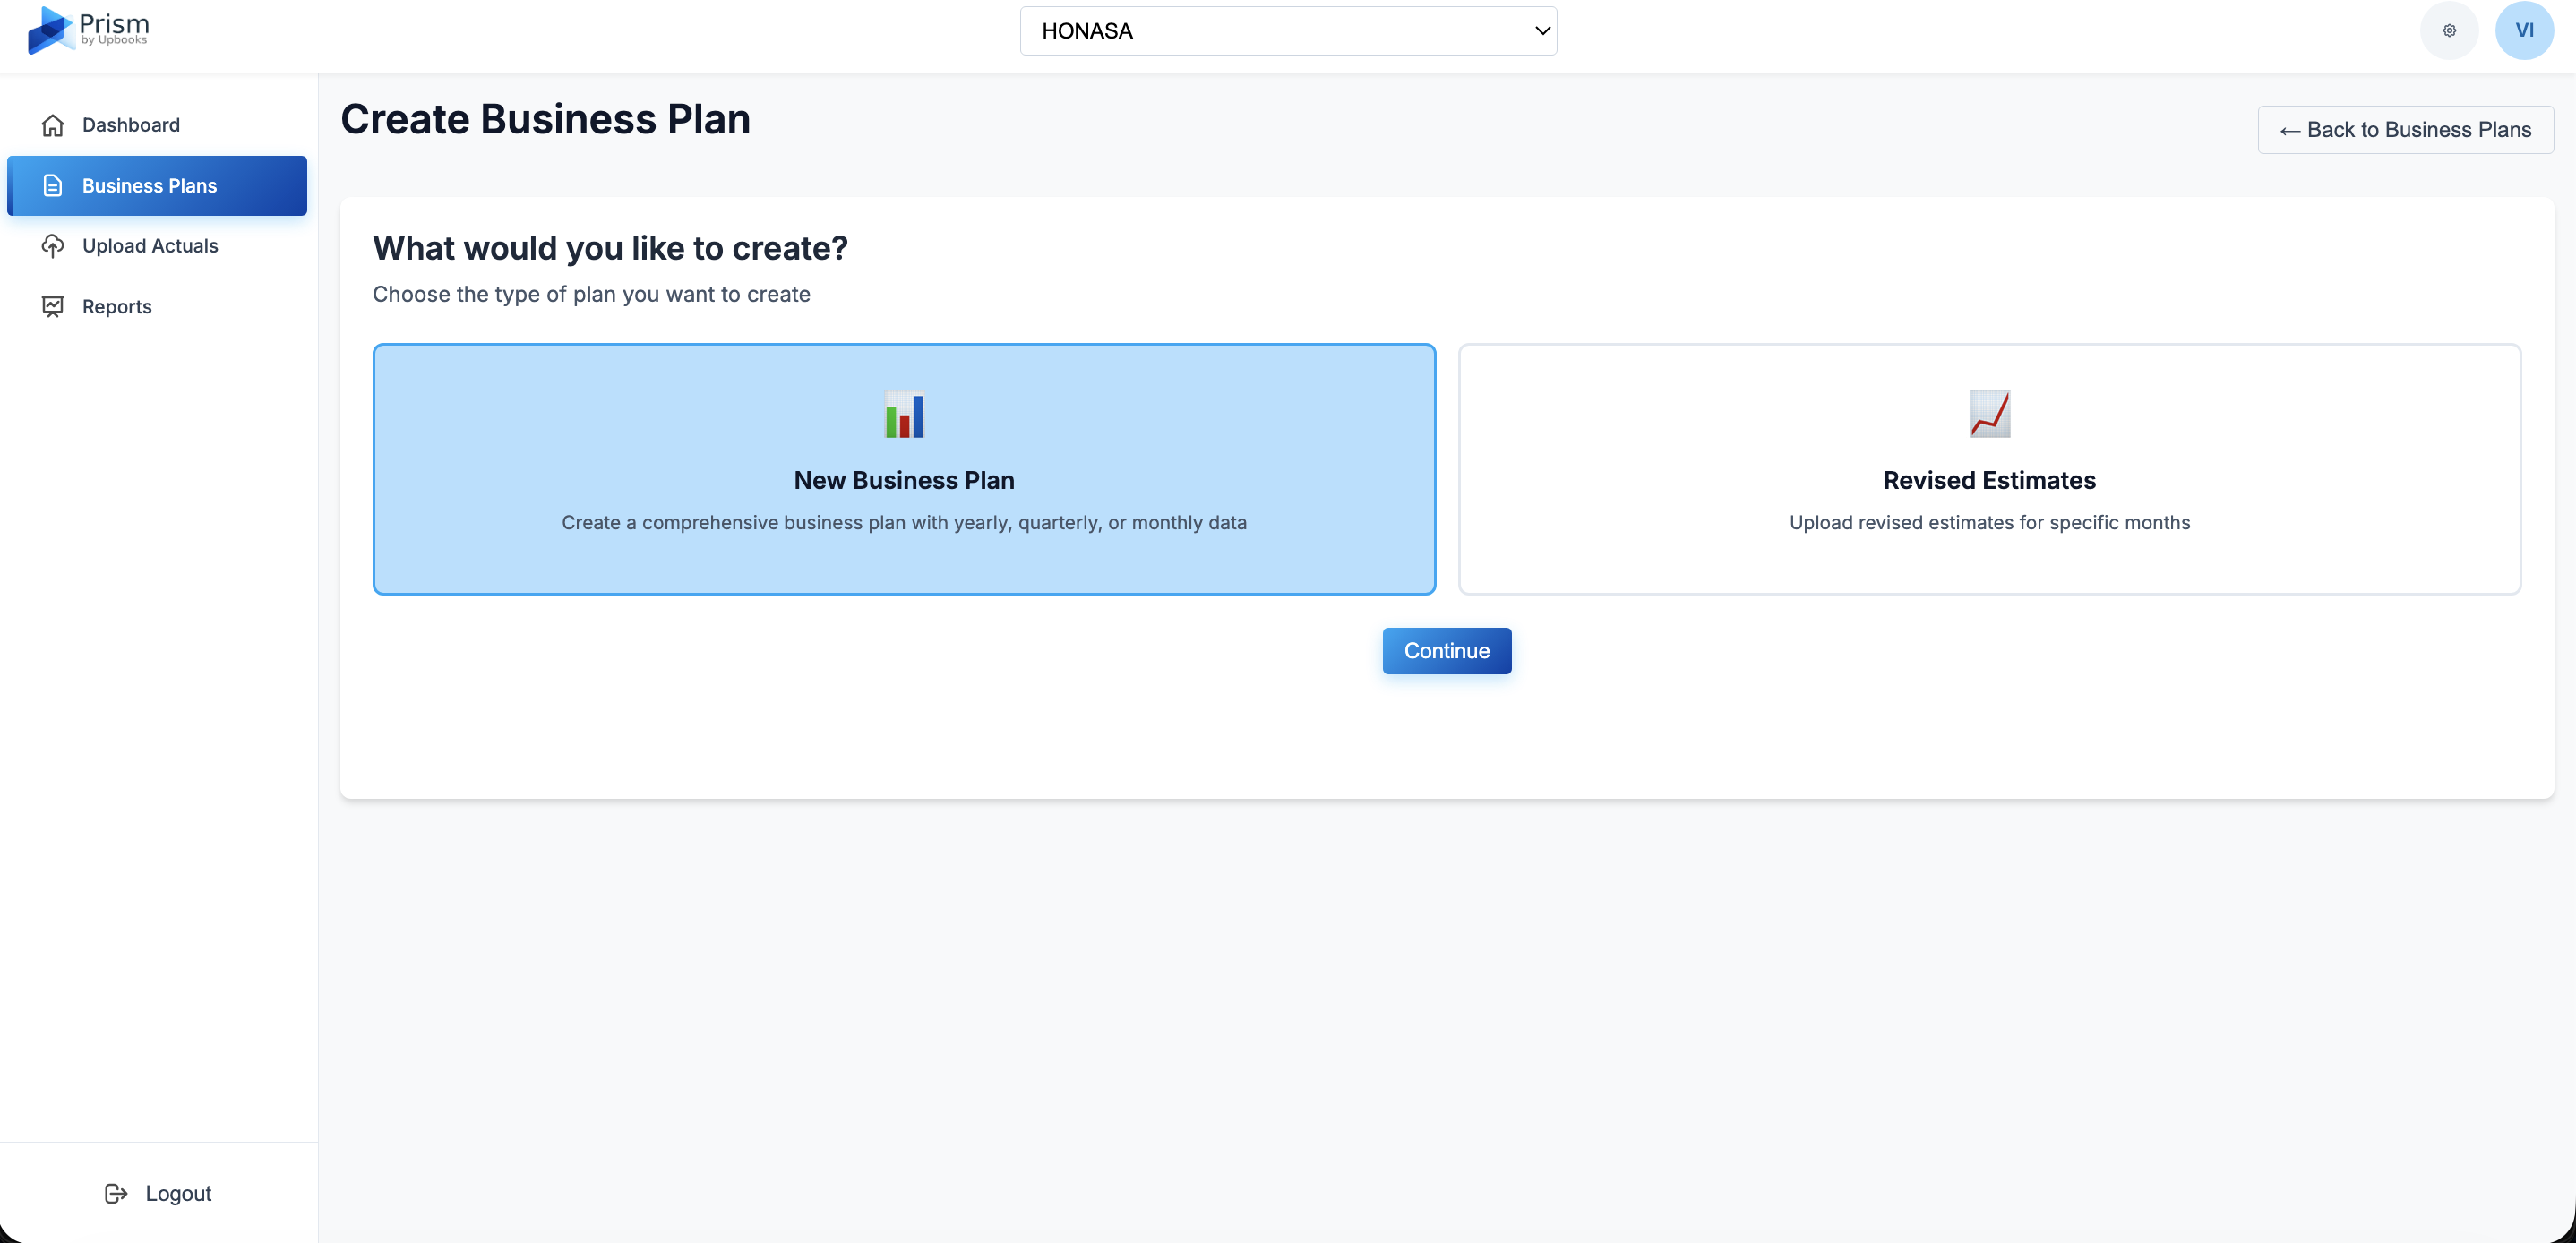
Create Business Plan
What it does: Step-by-step creation of new plans or revised estimates.
- Simple setup – Choose whether you are creating a new plan or updating existing numbers
- Flexible planning – Create full-year, quarterly, or monthly plans
- Upload from Excel – Import budget data from spreadsheets instead of manual entry
- Channel-specific plans – Plan by sales channel (e.g. retail, online, wholesale)
- Department and cost center – Organize plans by team or cost center
- Revised estimates – Update forecasts when circumstances change
- Pick months to update – Choose which months to revise when updating estimates
Benefits for your business
Get started quickly with flexible options that fit your business structure.
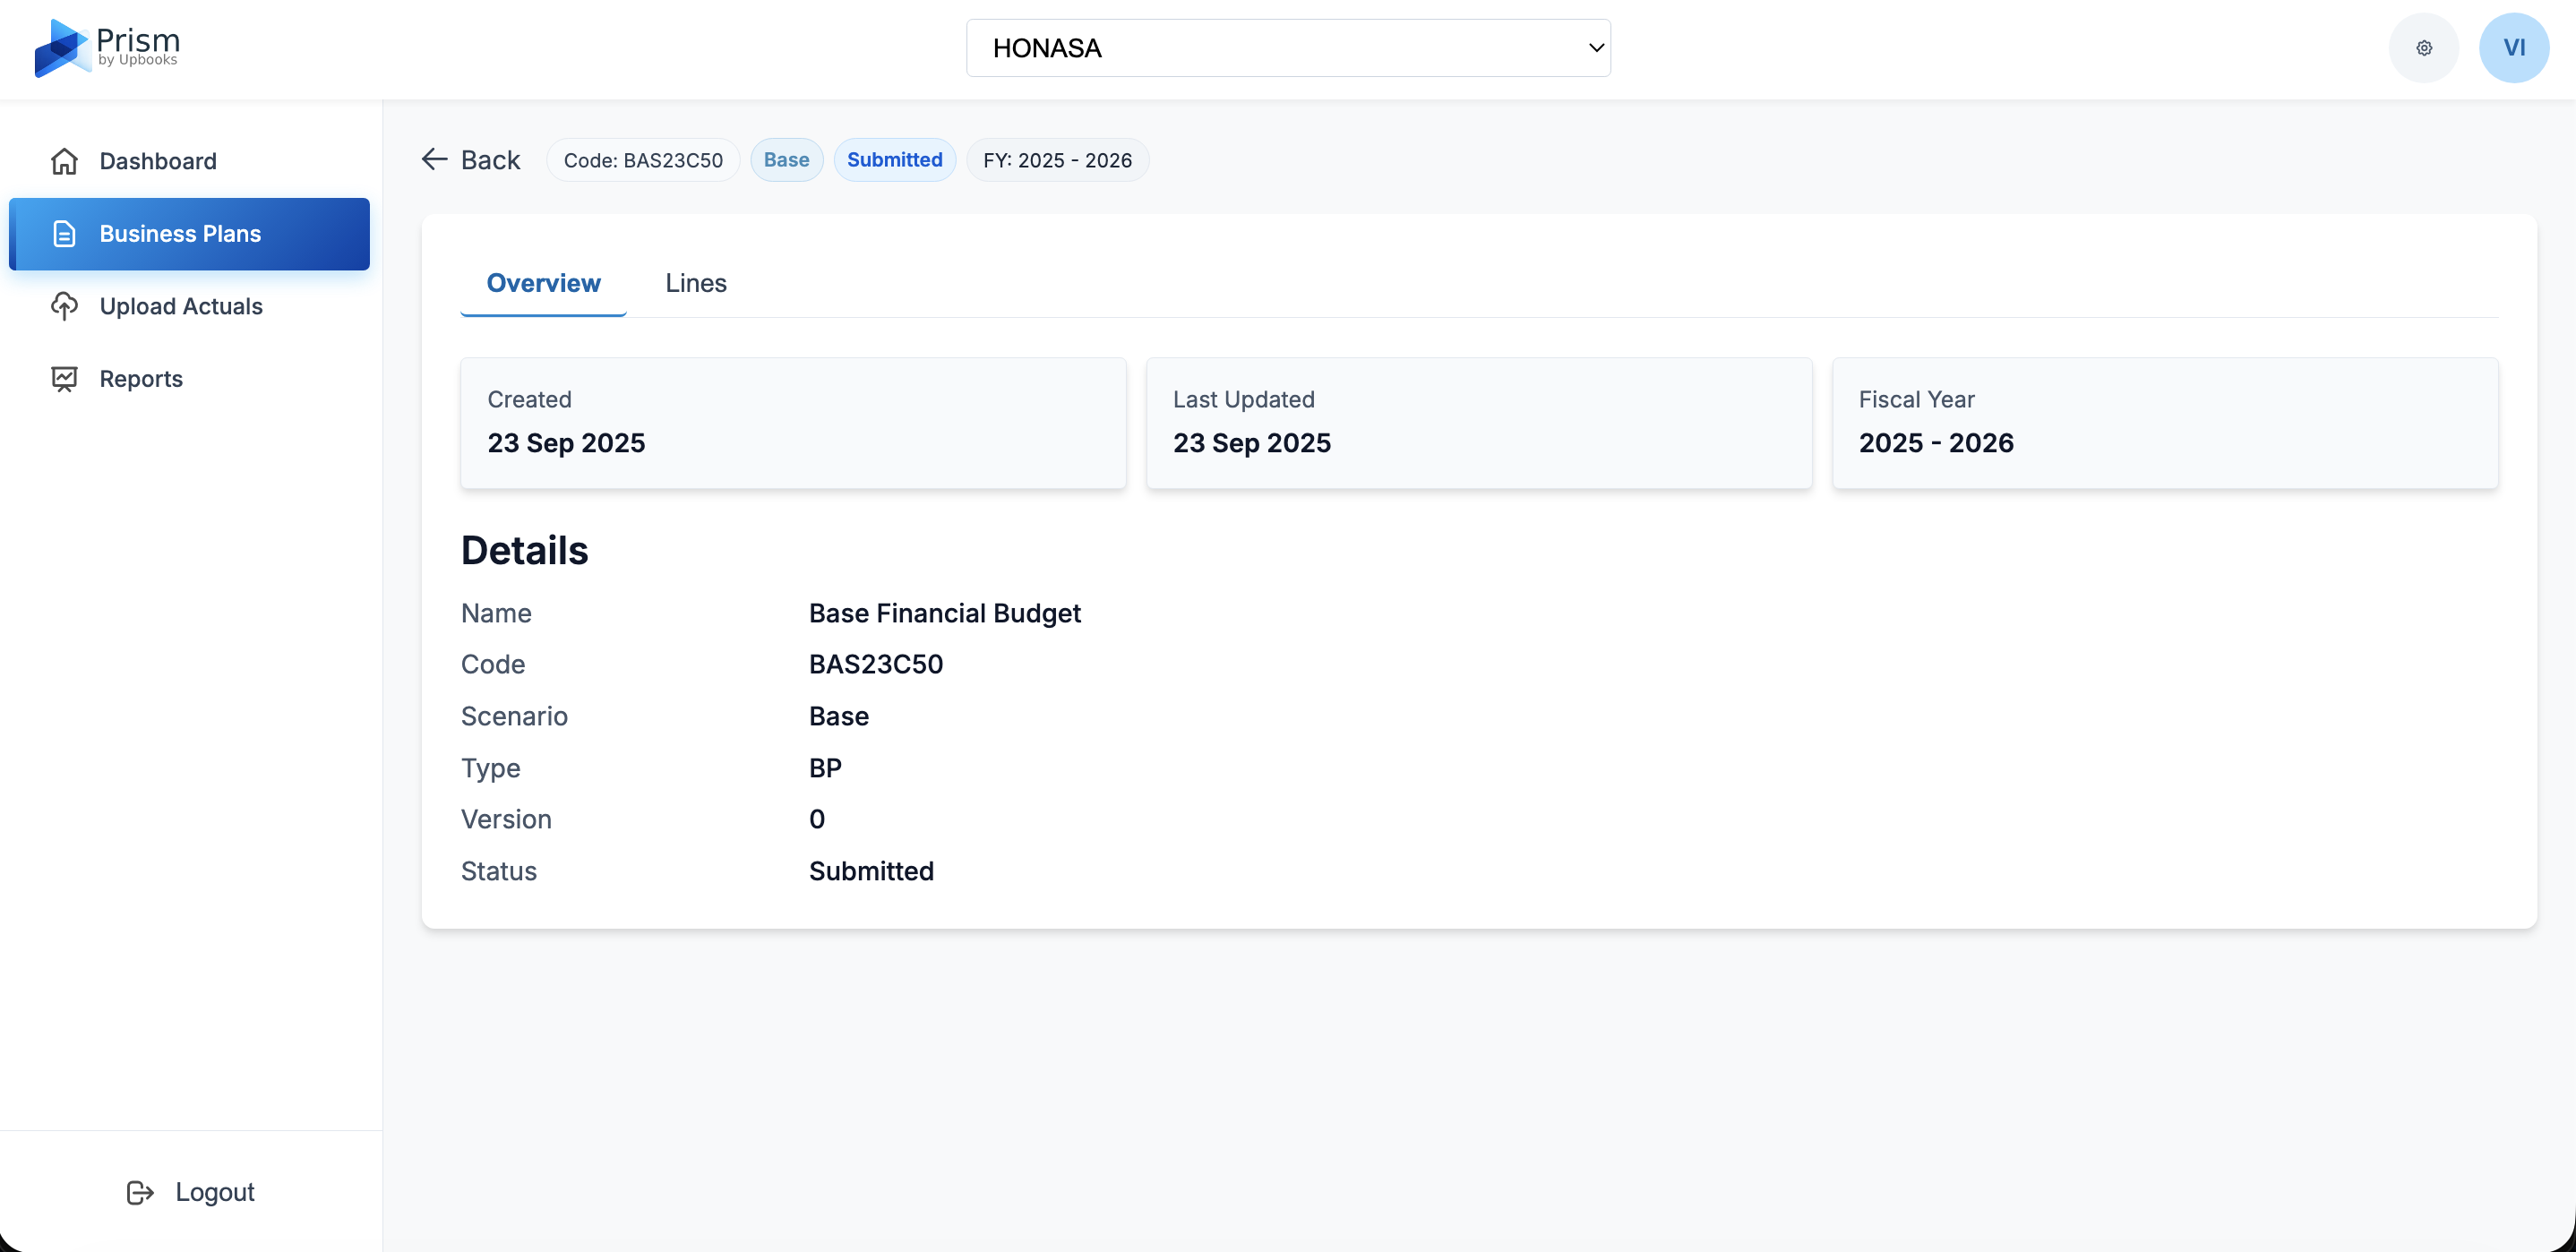
Business Plan Detail / View
What it does: Detailed view of any plan, including all line items and values.
- Everything in one view – See all revenue, expenses, and other items in a plan
- Monthly, quarterly, or yearly view – Switch how you look at numbers
- Split by channel or center – View by sales channel, cost center, or profit center
- Clear audit trail – See creation and last update dates for each plan
Benefits for your business
Review and understand any plan in detail without losing context.
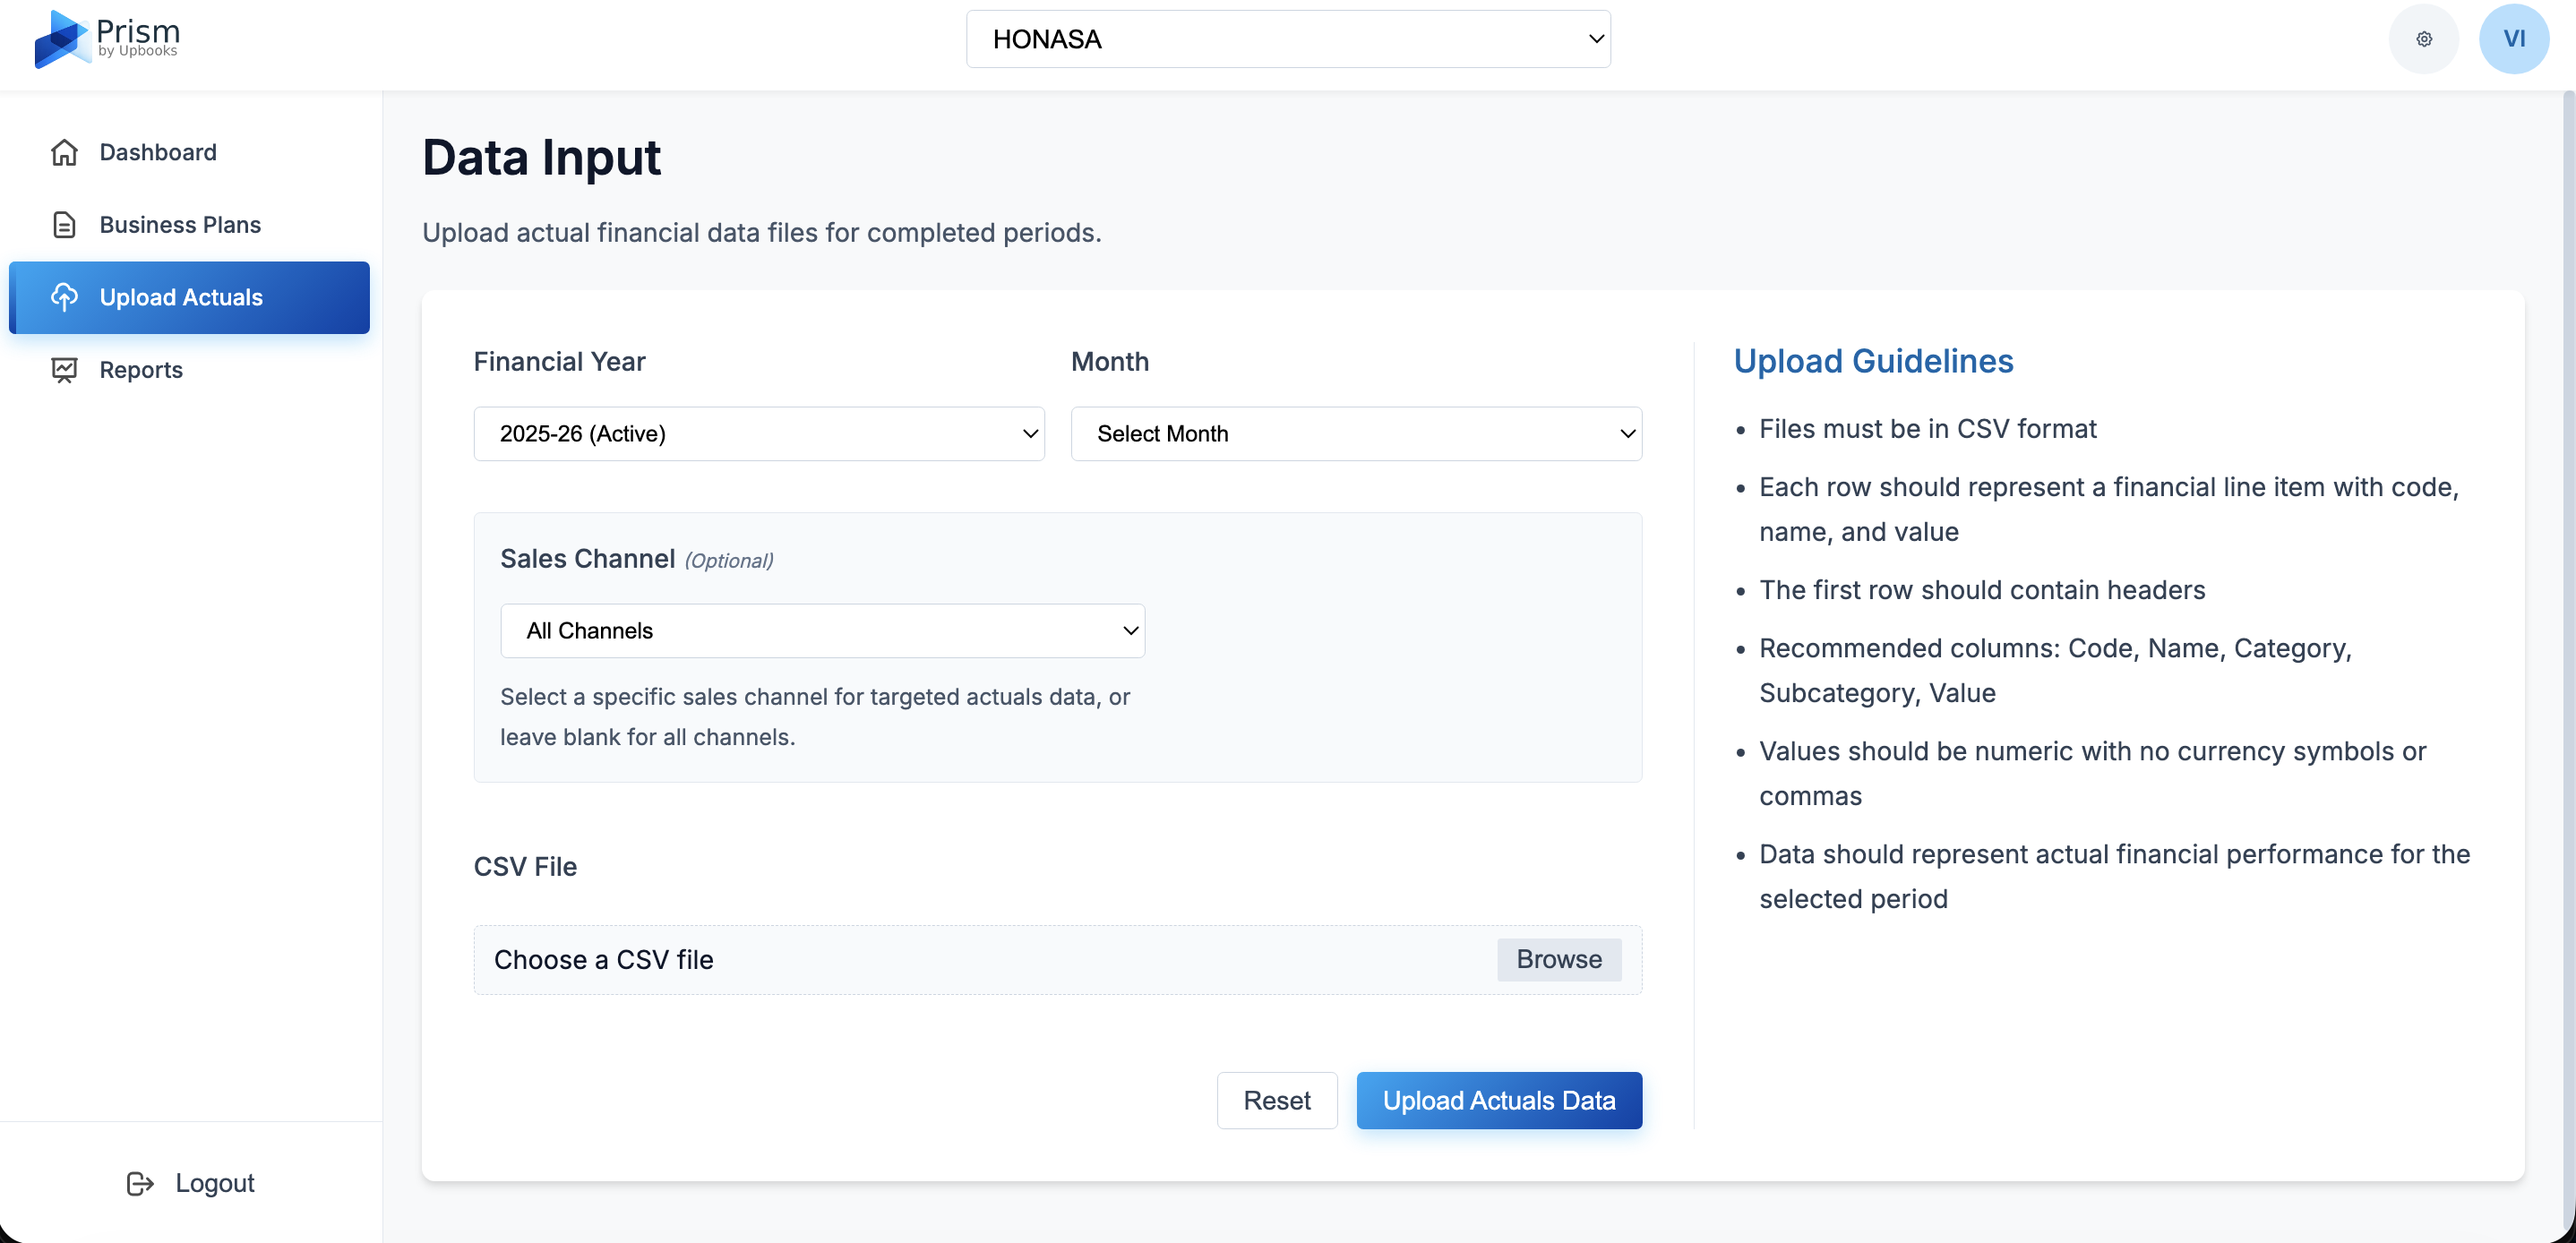
Data Input
What it does: Upload real financial results into the system.
- Easy upload – Upload actual numbers using a CSV file
- Select the right period – Choose year and month for the data
- Optional channel filter – Upload data for specific sales channels
- Less manual work – Upload bulk data instead of typing it in
- Validated data – System checks format so you avoid basic errors
Benefits for your business
Get real numbers into the system quickly and reliably.
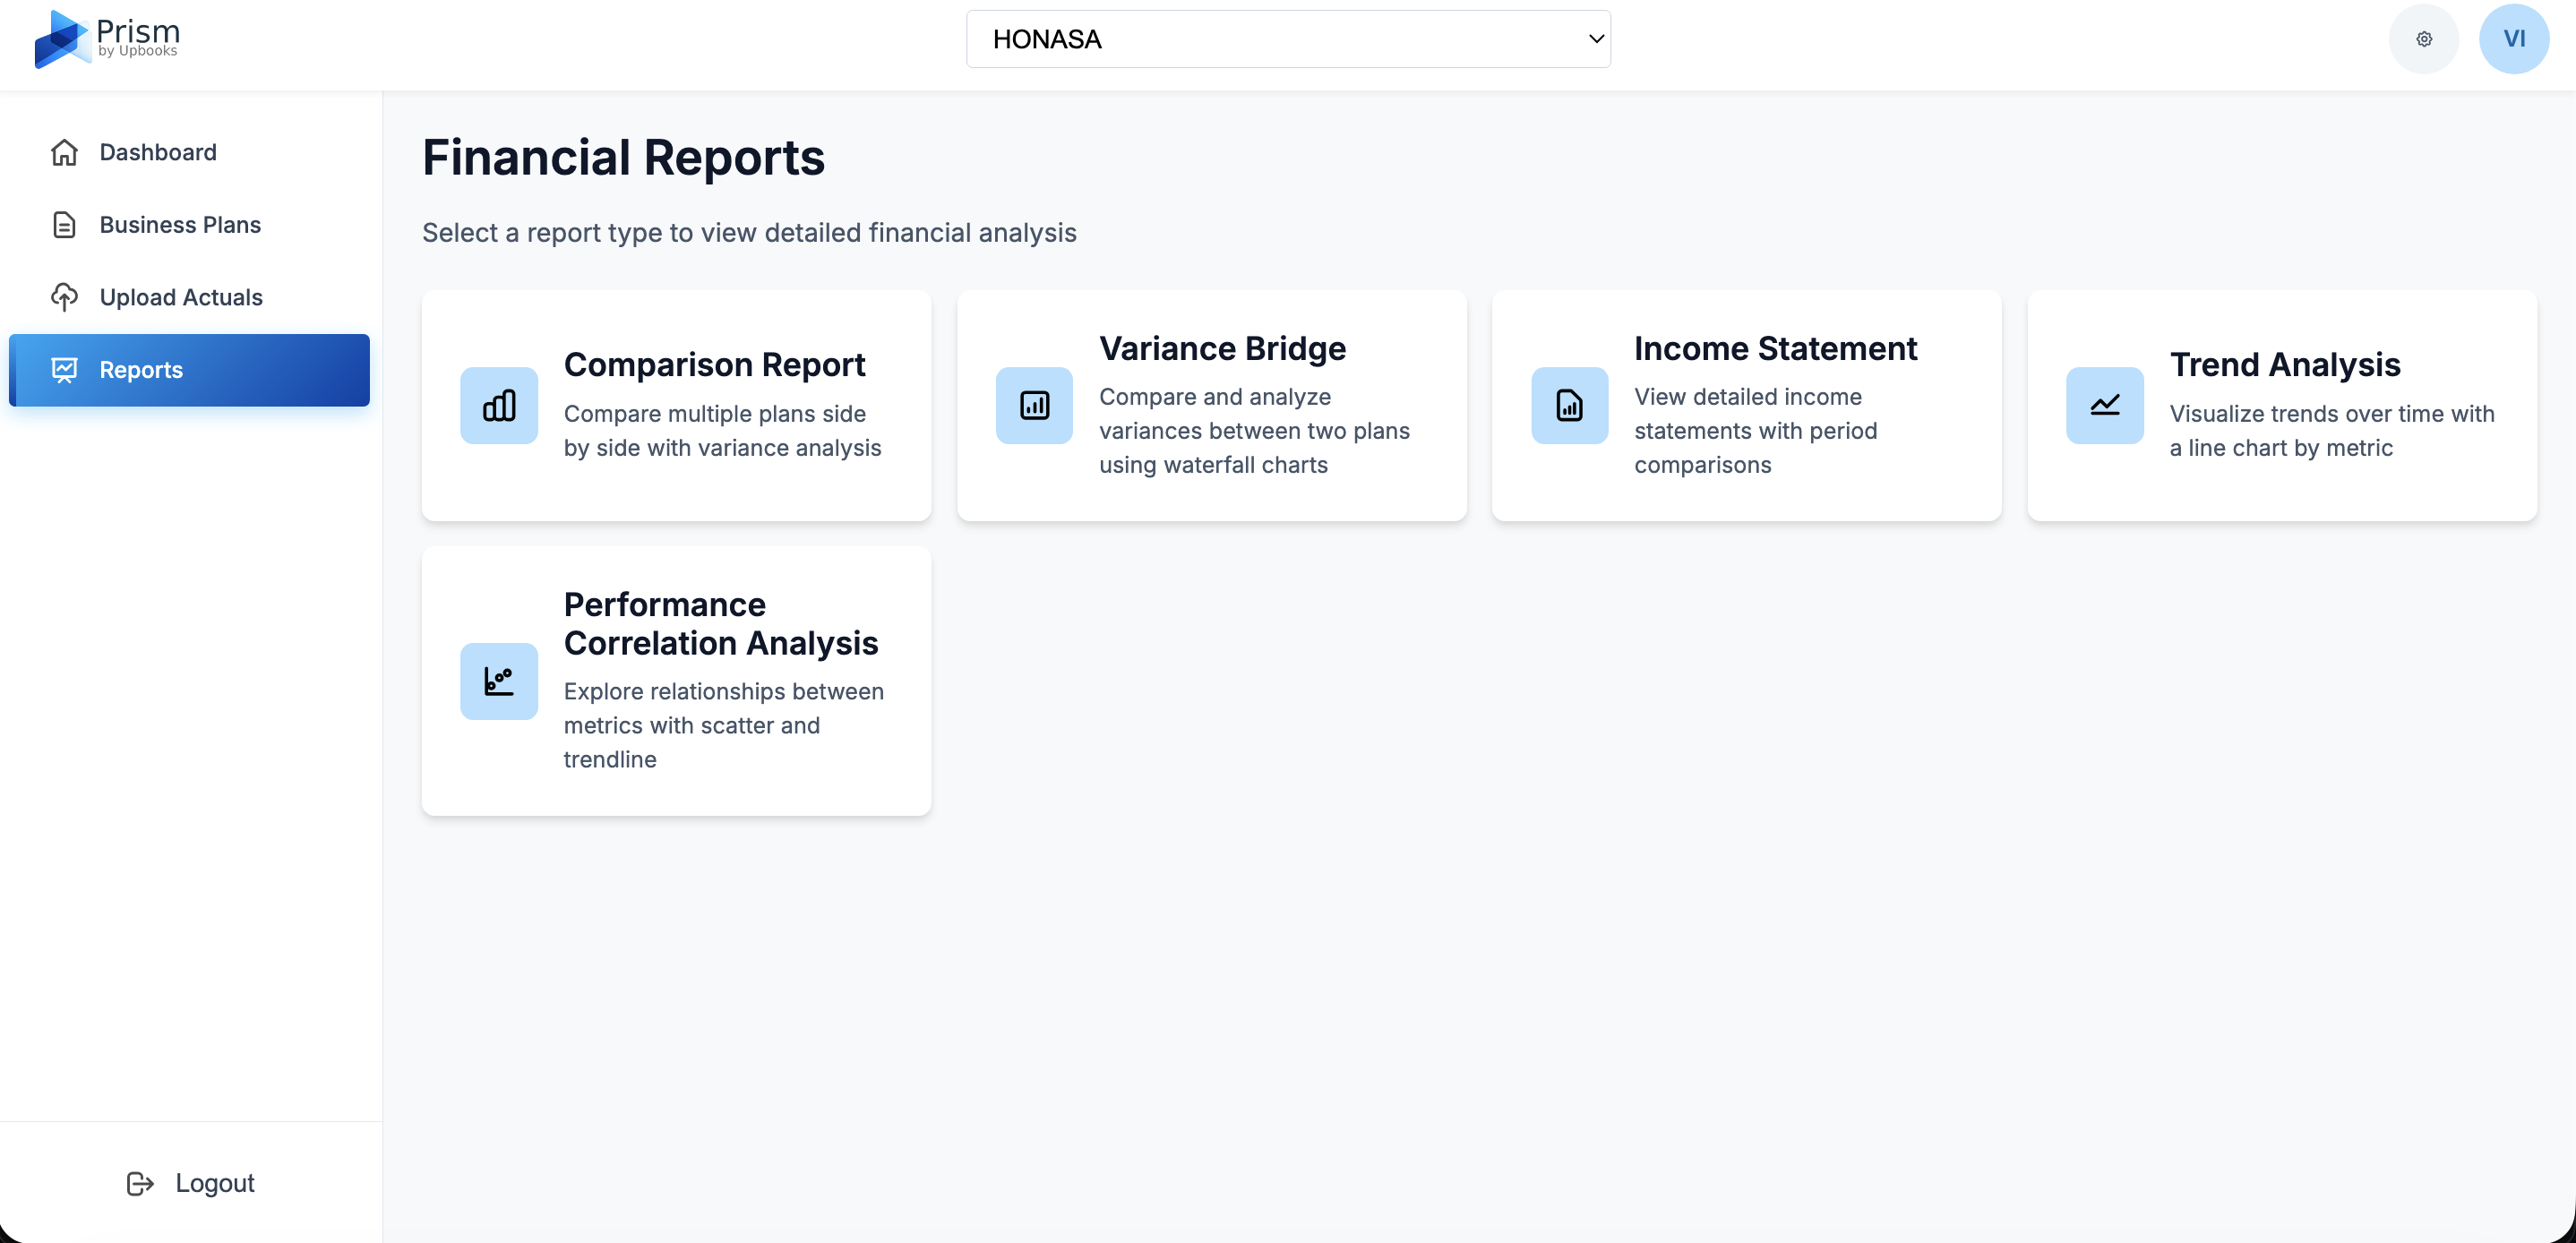
Reports
What it does: A central place to access different financial reports.
- Reports in one place – Go to one section and choose the report you need
- Professional reports – Get structured reports suitable for meetings and management
Benefits for your business
One place to find all the reports you need for decision-making.
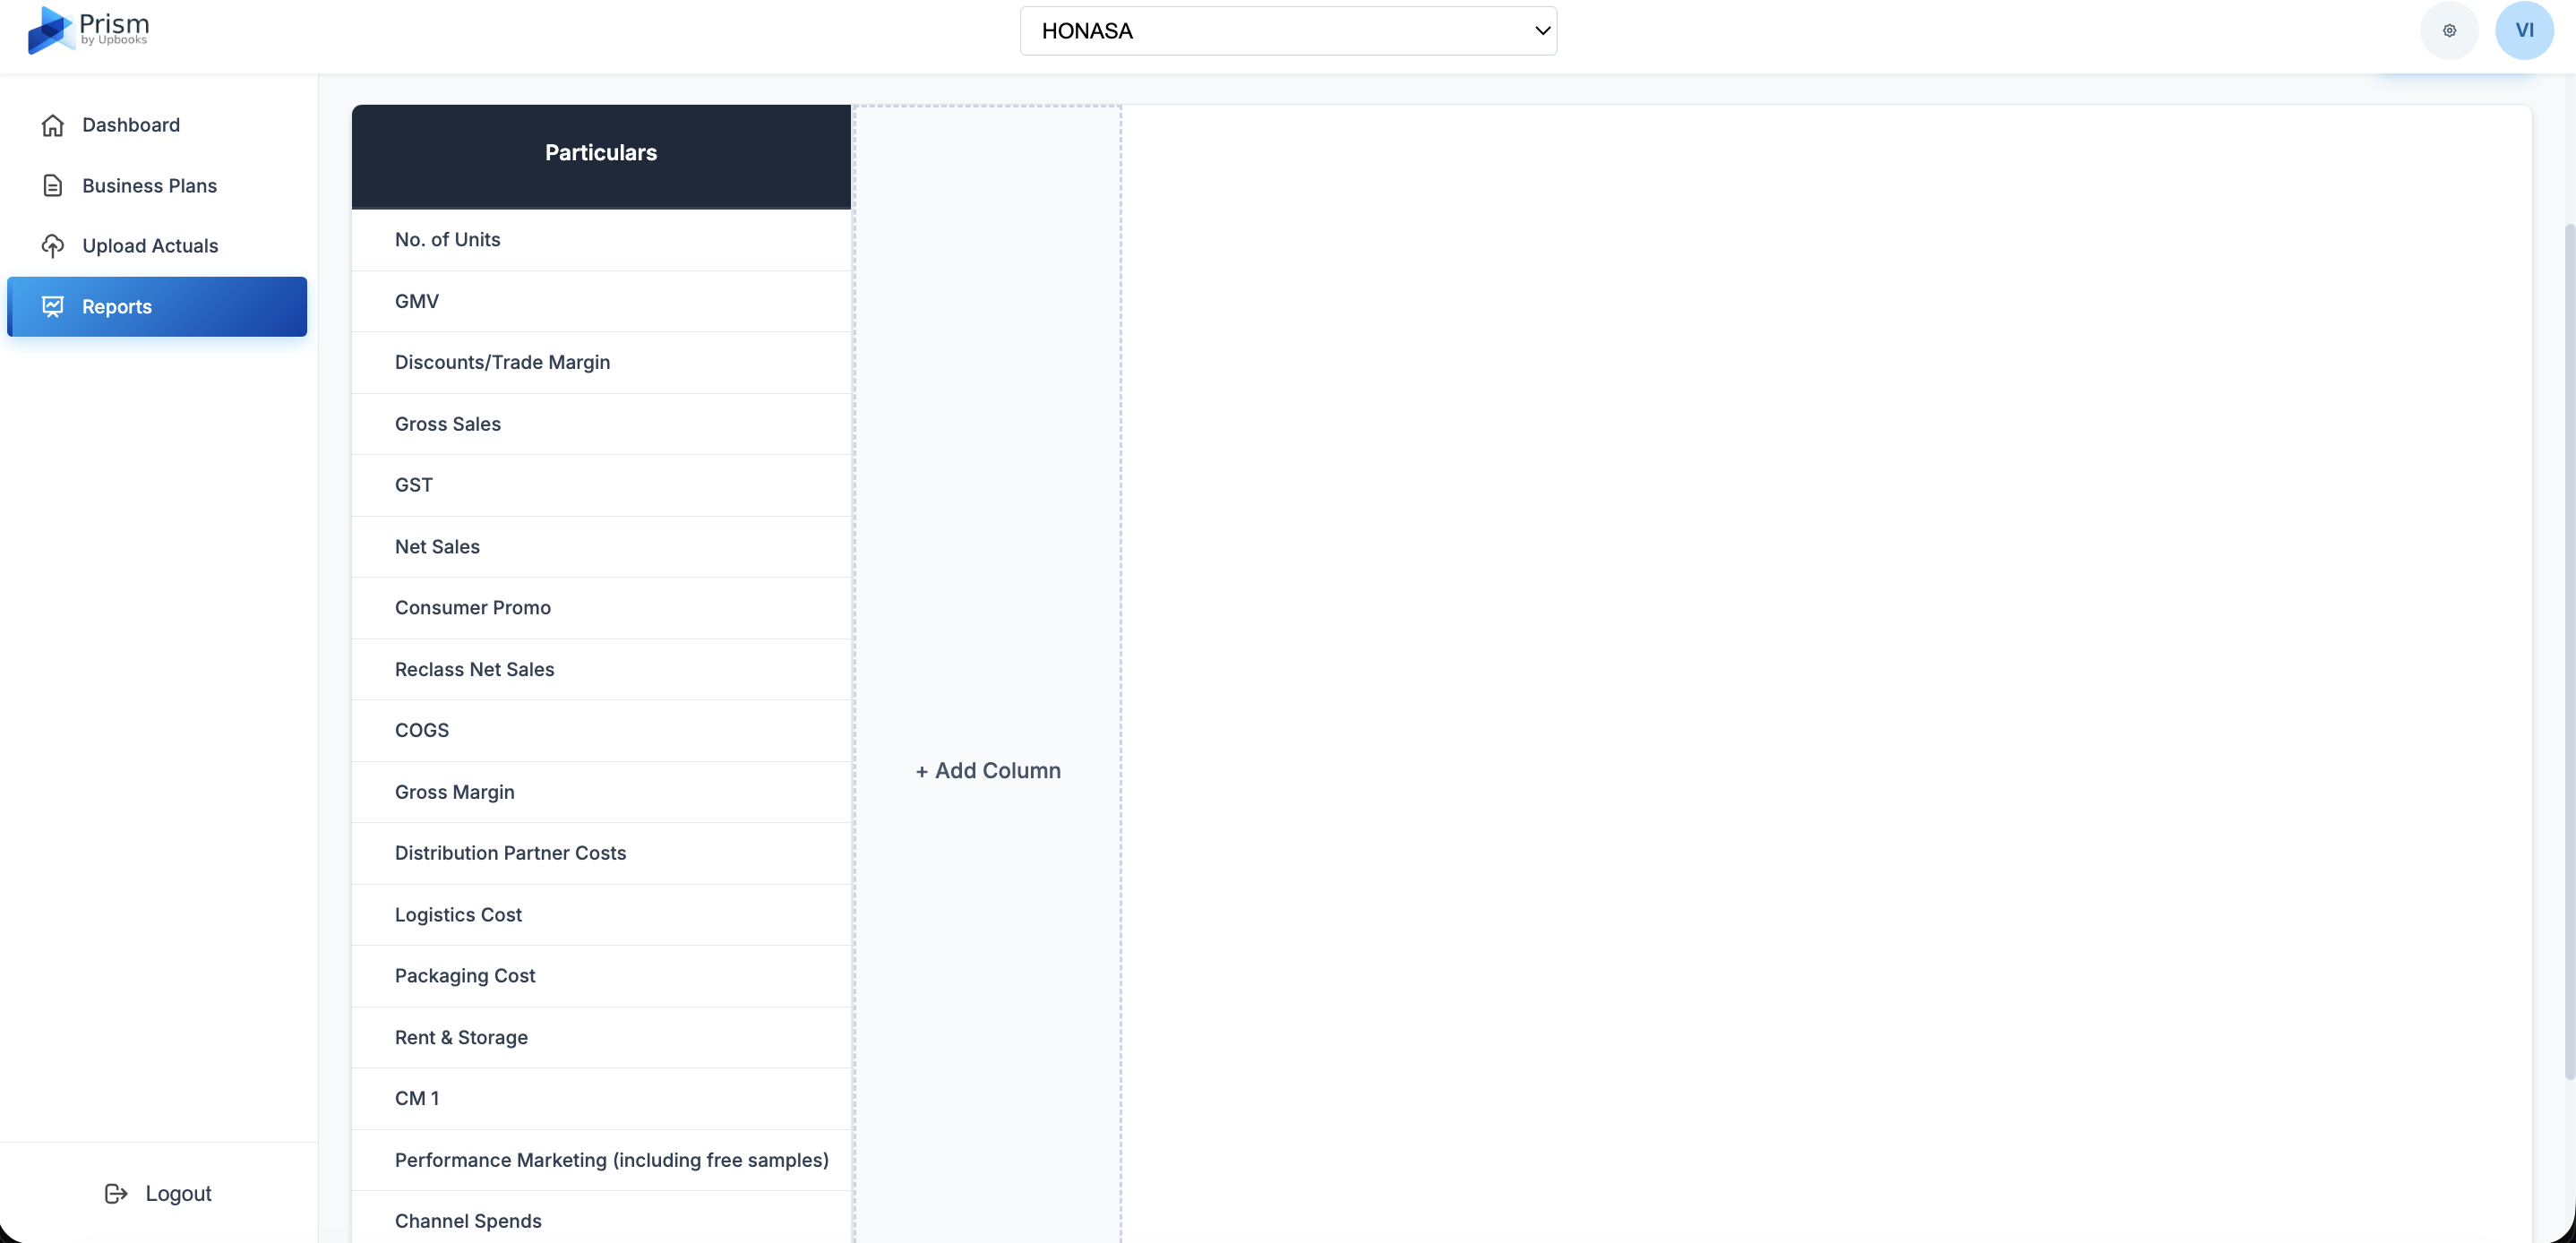
Comparison Report
What it does: Side-by-side comparison of multiple plans with differences and trends.
- Multiple plans at once – Compare several plans or actuals in one view
- See differences – Immediately see how numbers differ
- Trend indicators – See whether values are going up or down and by how much
- Export and share – Download as PDF or email to stakeholders
- Custom columns – Add the plans and periods you care about
Benefits for your business
Understand how plans differ and make informed decisions quickly.
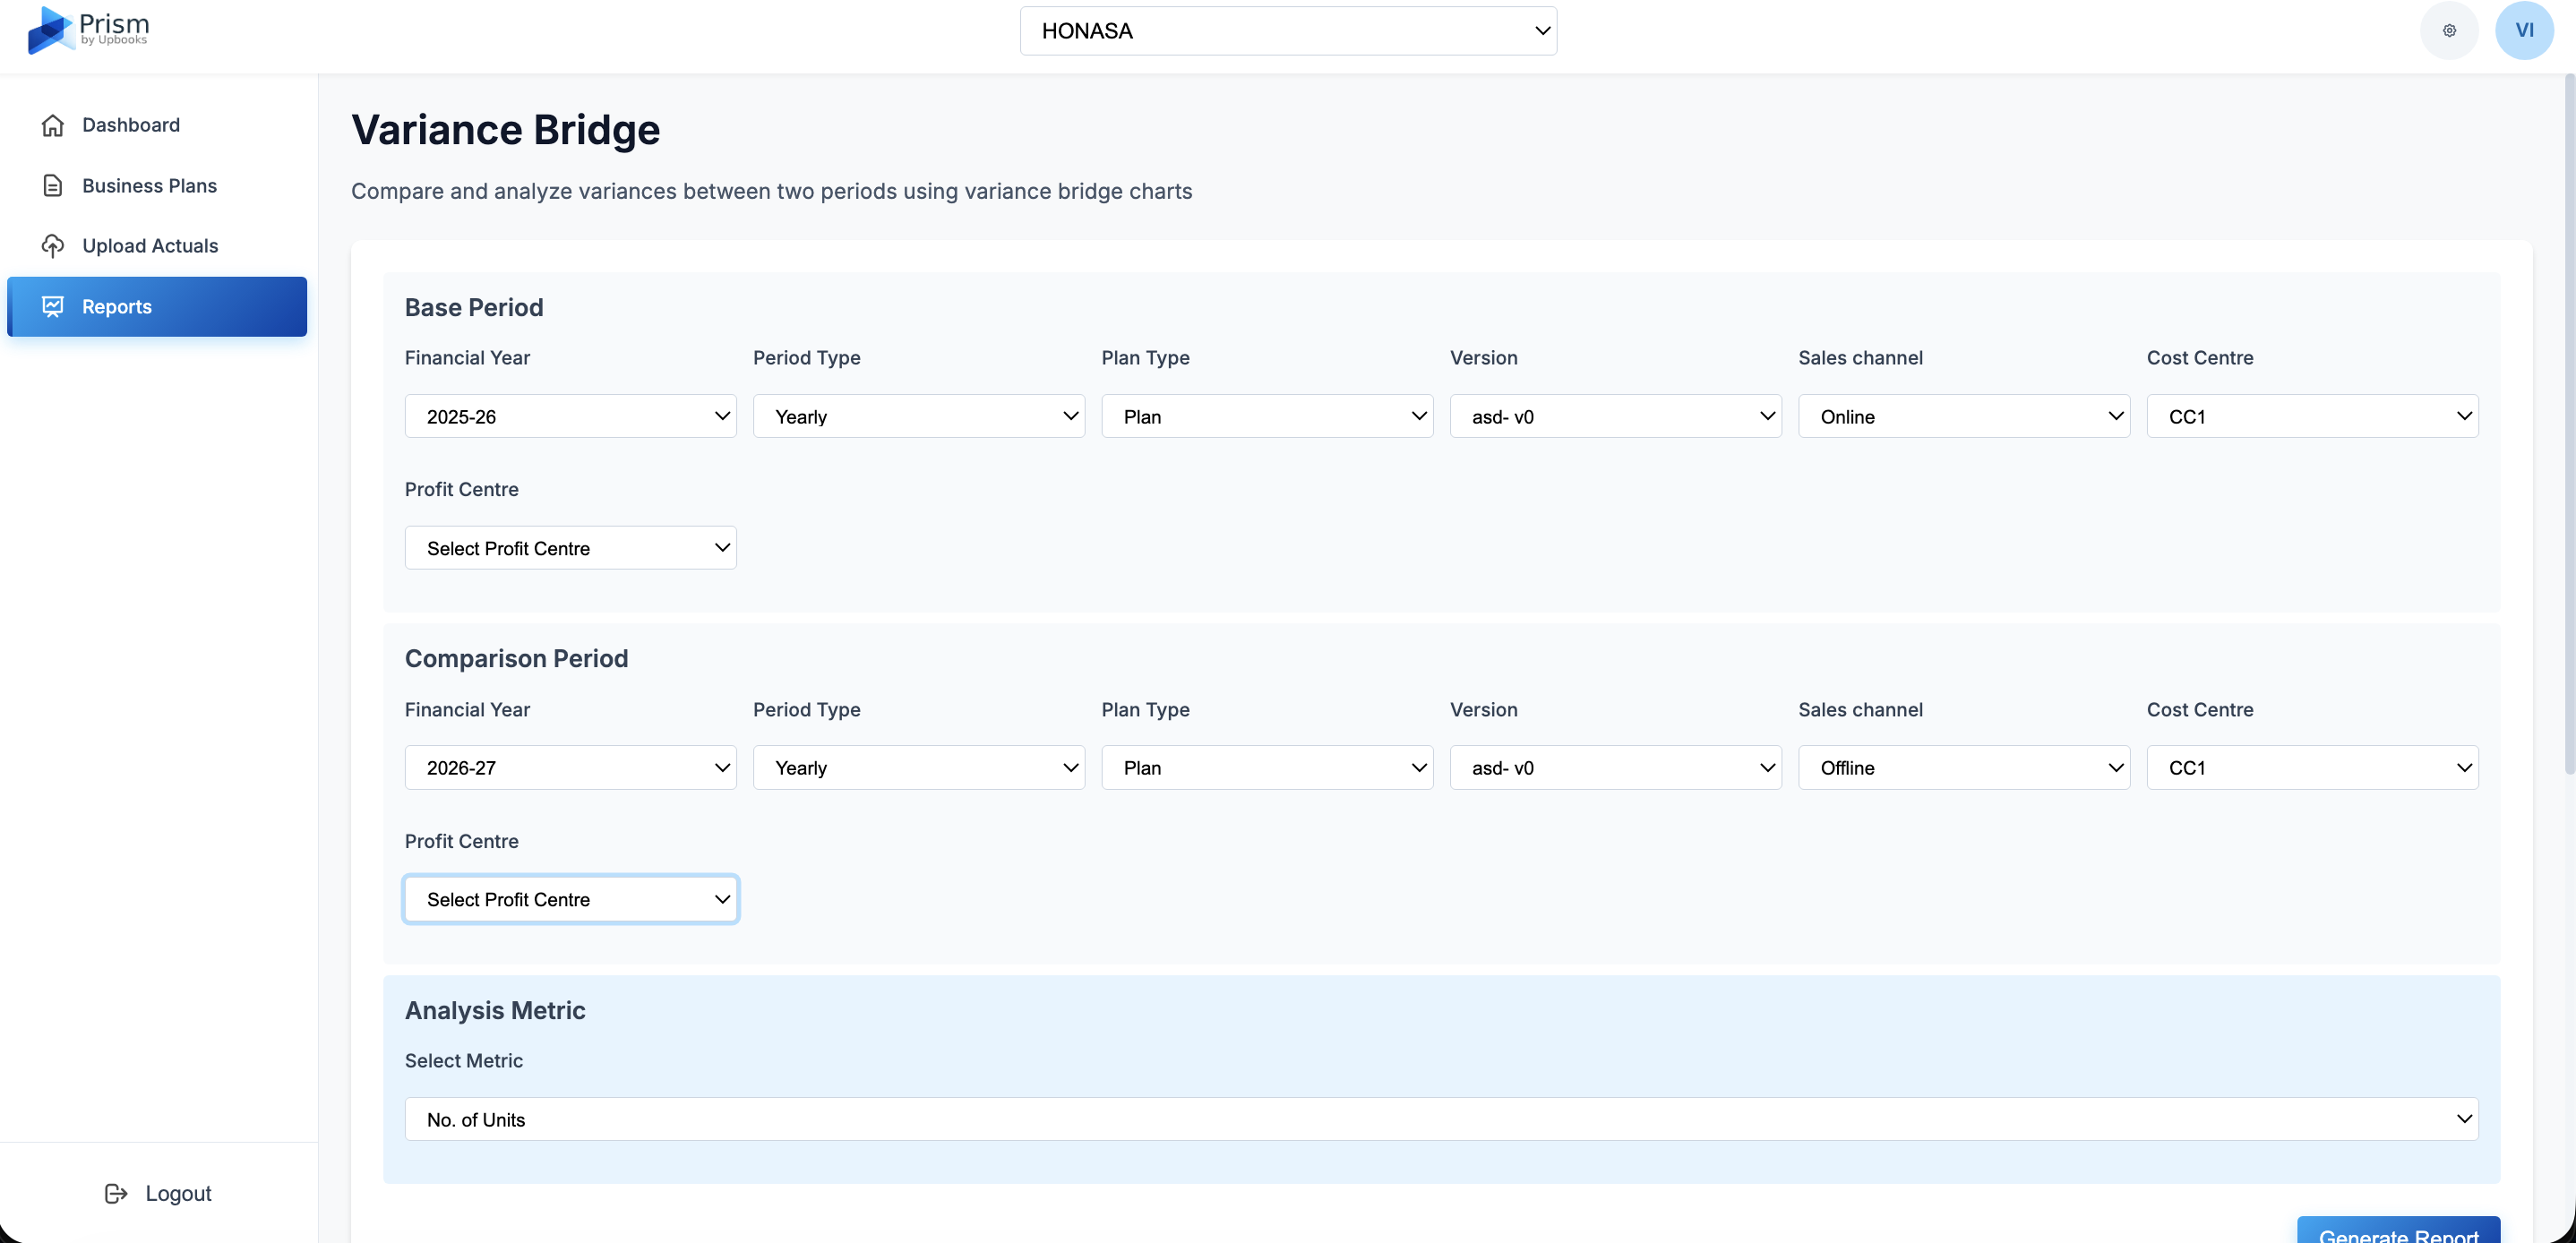
Variance Bridge (Waterfall Analysis)
What it does: Visual breakdown of how numbers changed from one period or plans to another.
- Visual explanation – See step-by-step why totals changed
- Understand drivers – Identify which items (e.g. revenue, costs) drove the change
- Present to others – Use the chart in management or board presentations
- Choose periods – Compare any two months, quarters, or years
Benefits for your business
Explain variance clearly to stakeholders with visual charts.
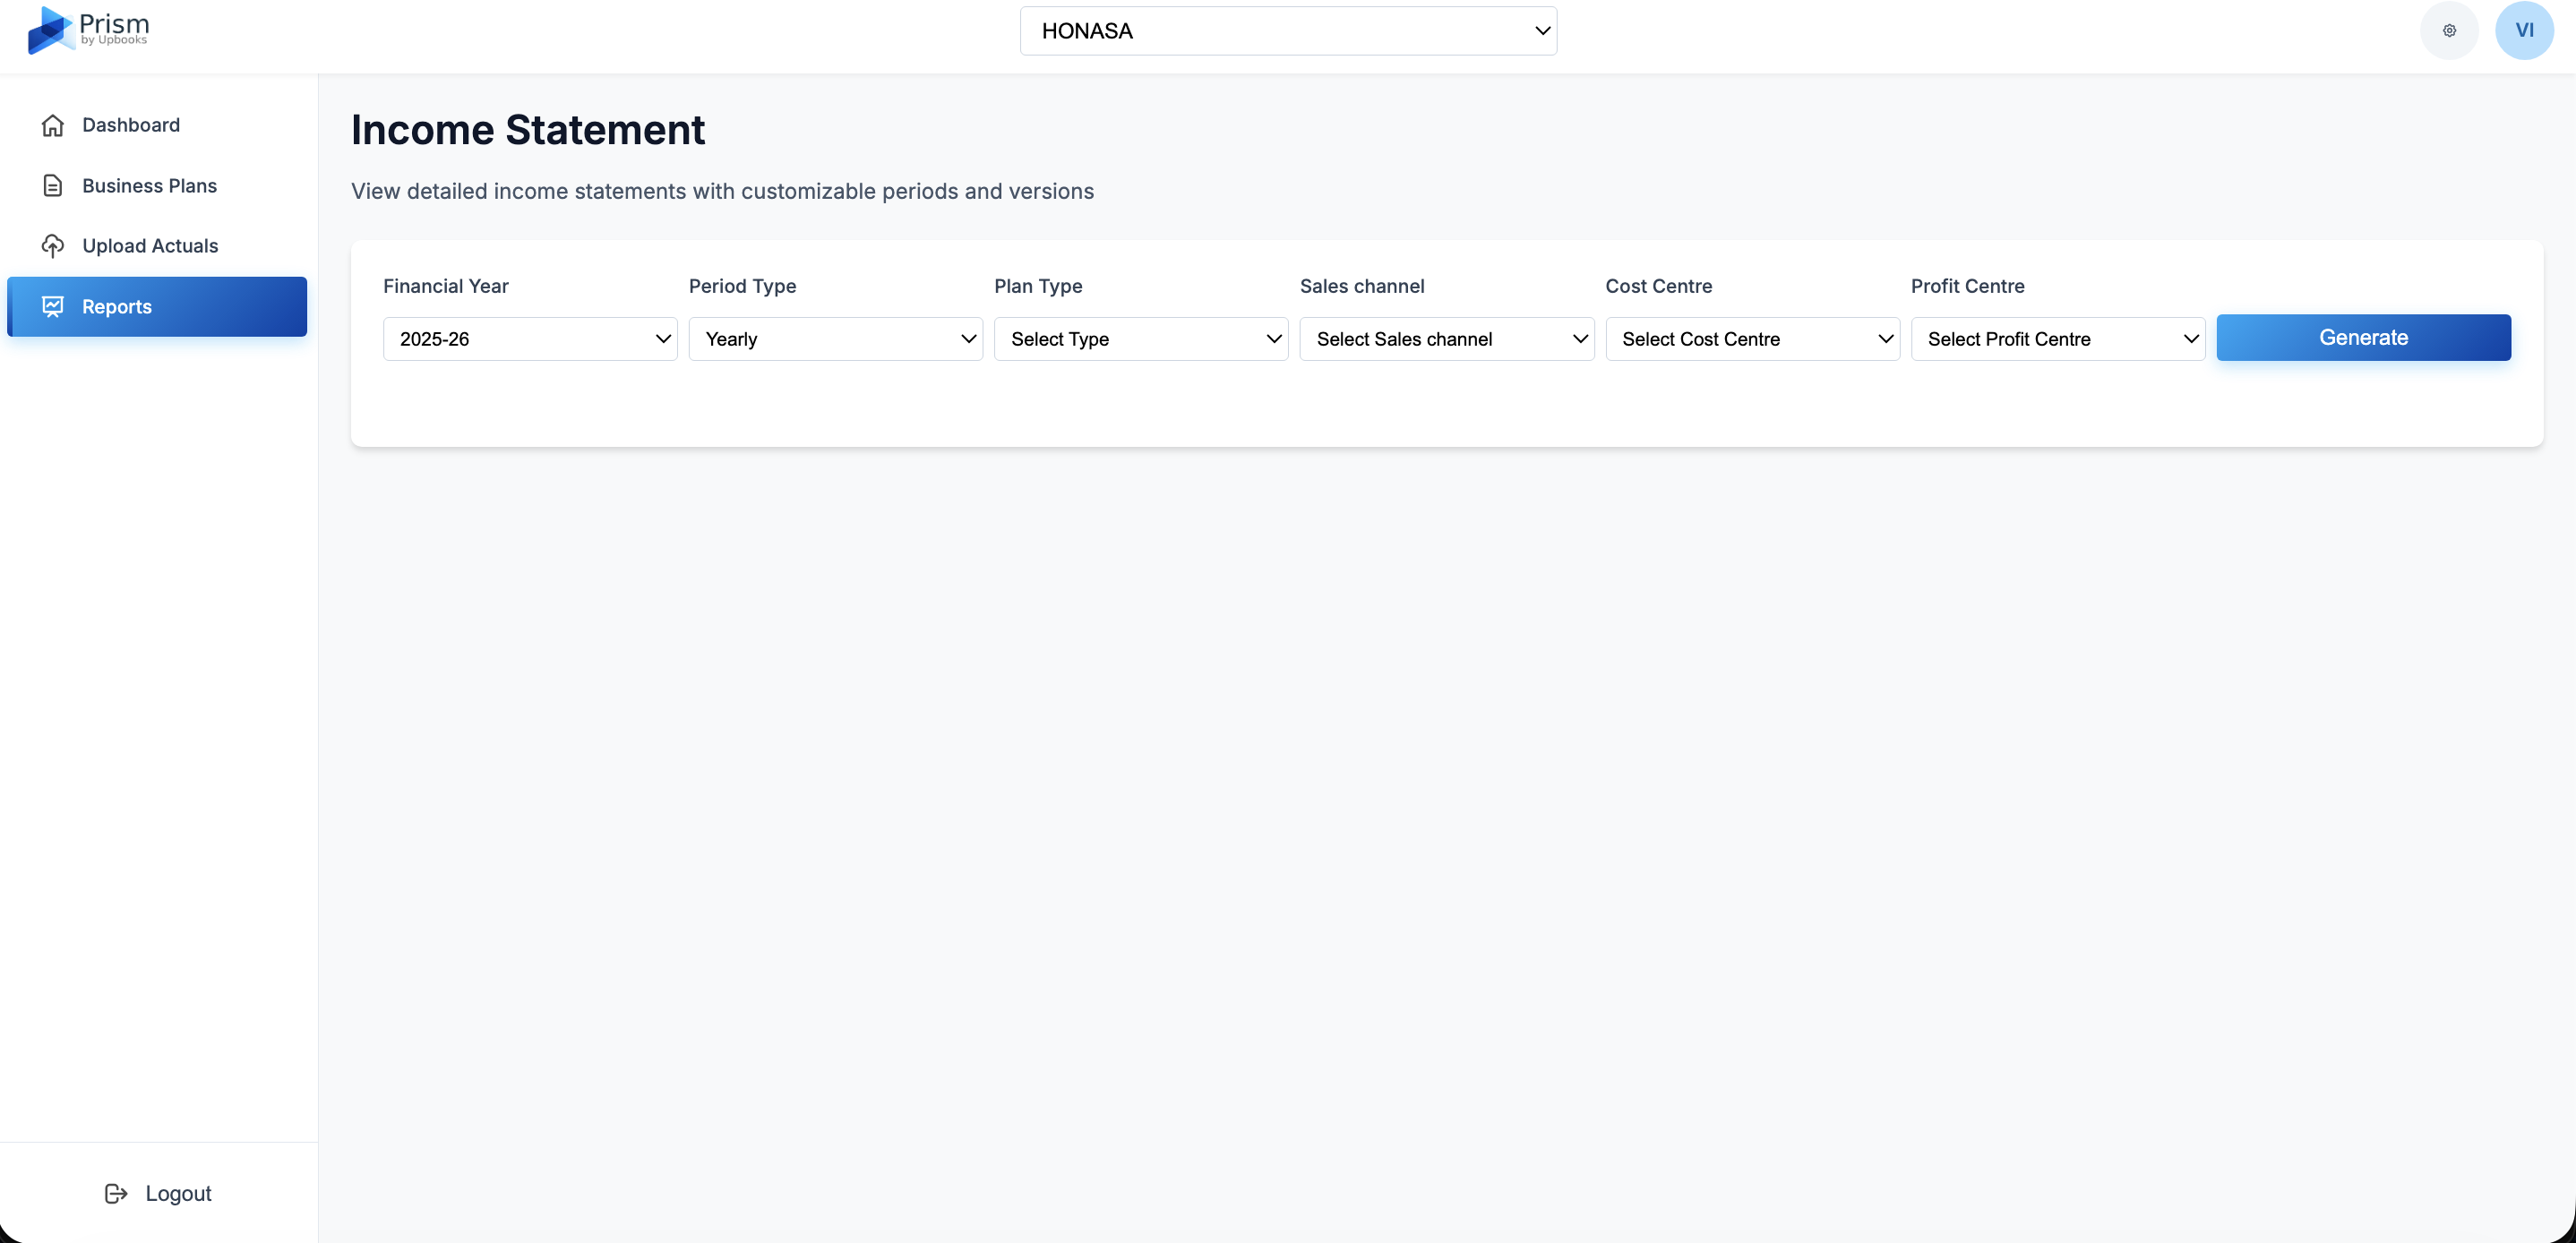
Income Statement
What it does: Standard income statement with revenue, expenses, and profit.
- Clear profit view – See revenue, costs, and profit at a glance
- Compare periods – Compare monthly, quarterly, or yearly
- Compare plans – See how different plans or scenarios affect income
Benefits for your business
Get the standard view you need for financial review.
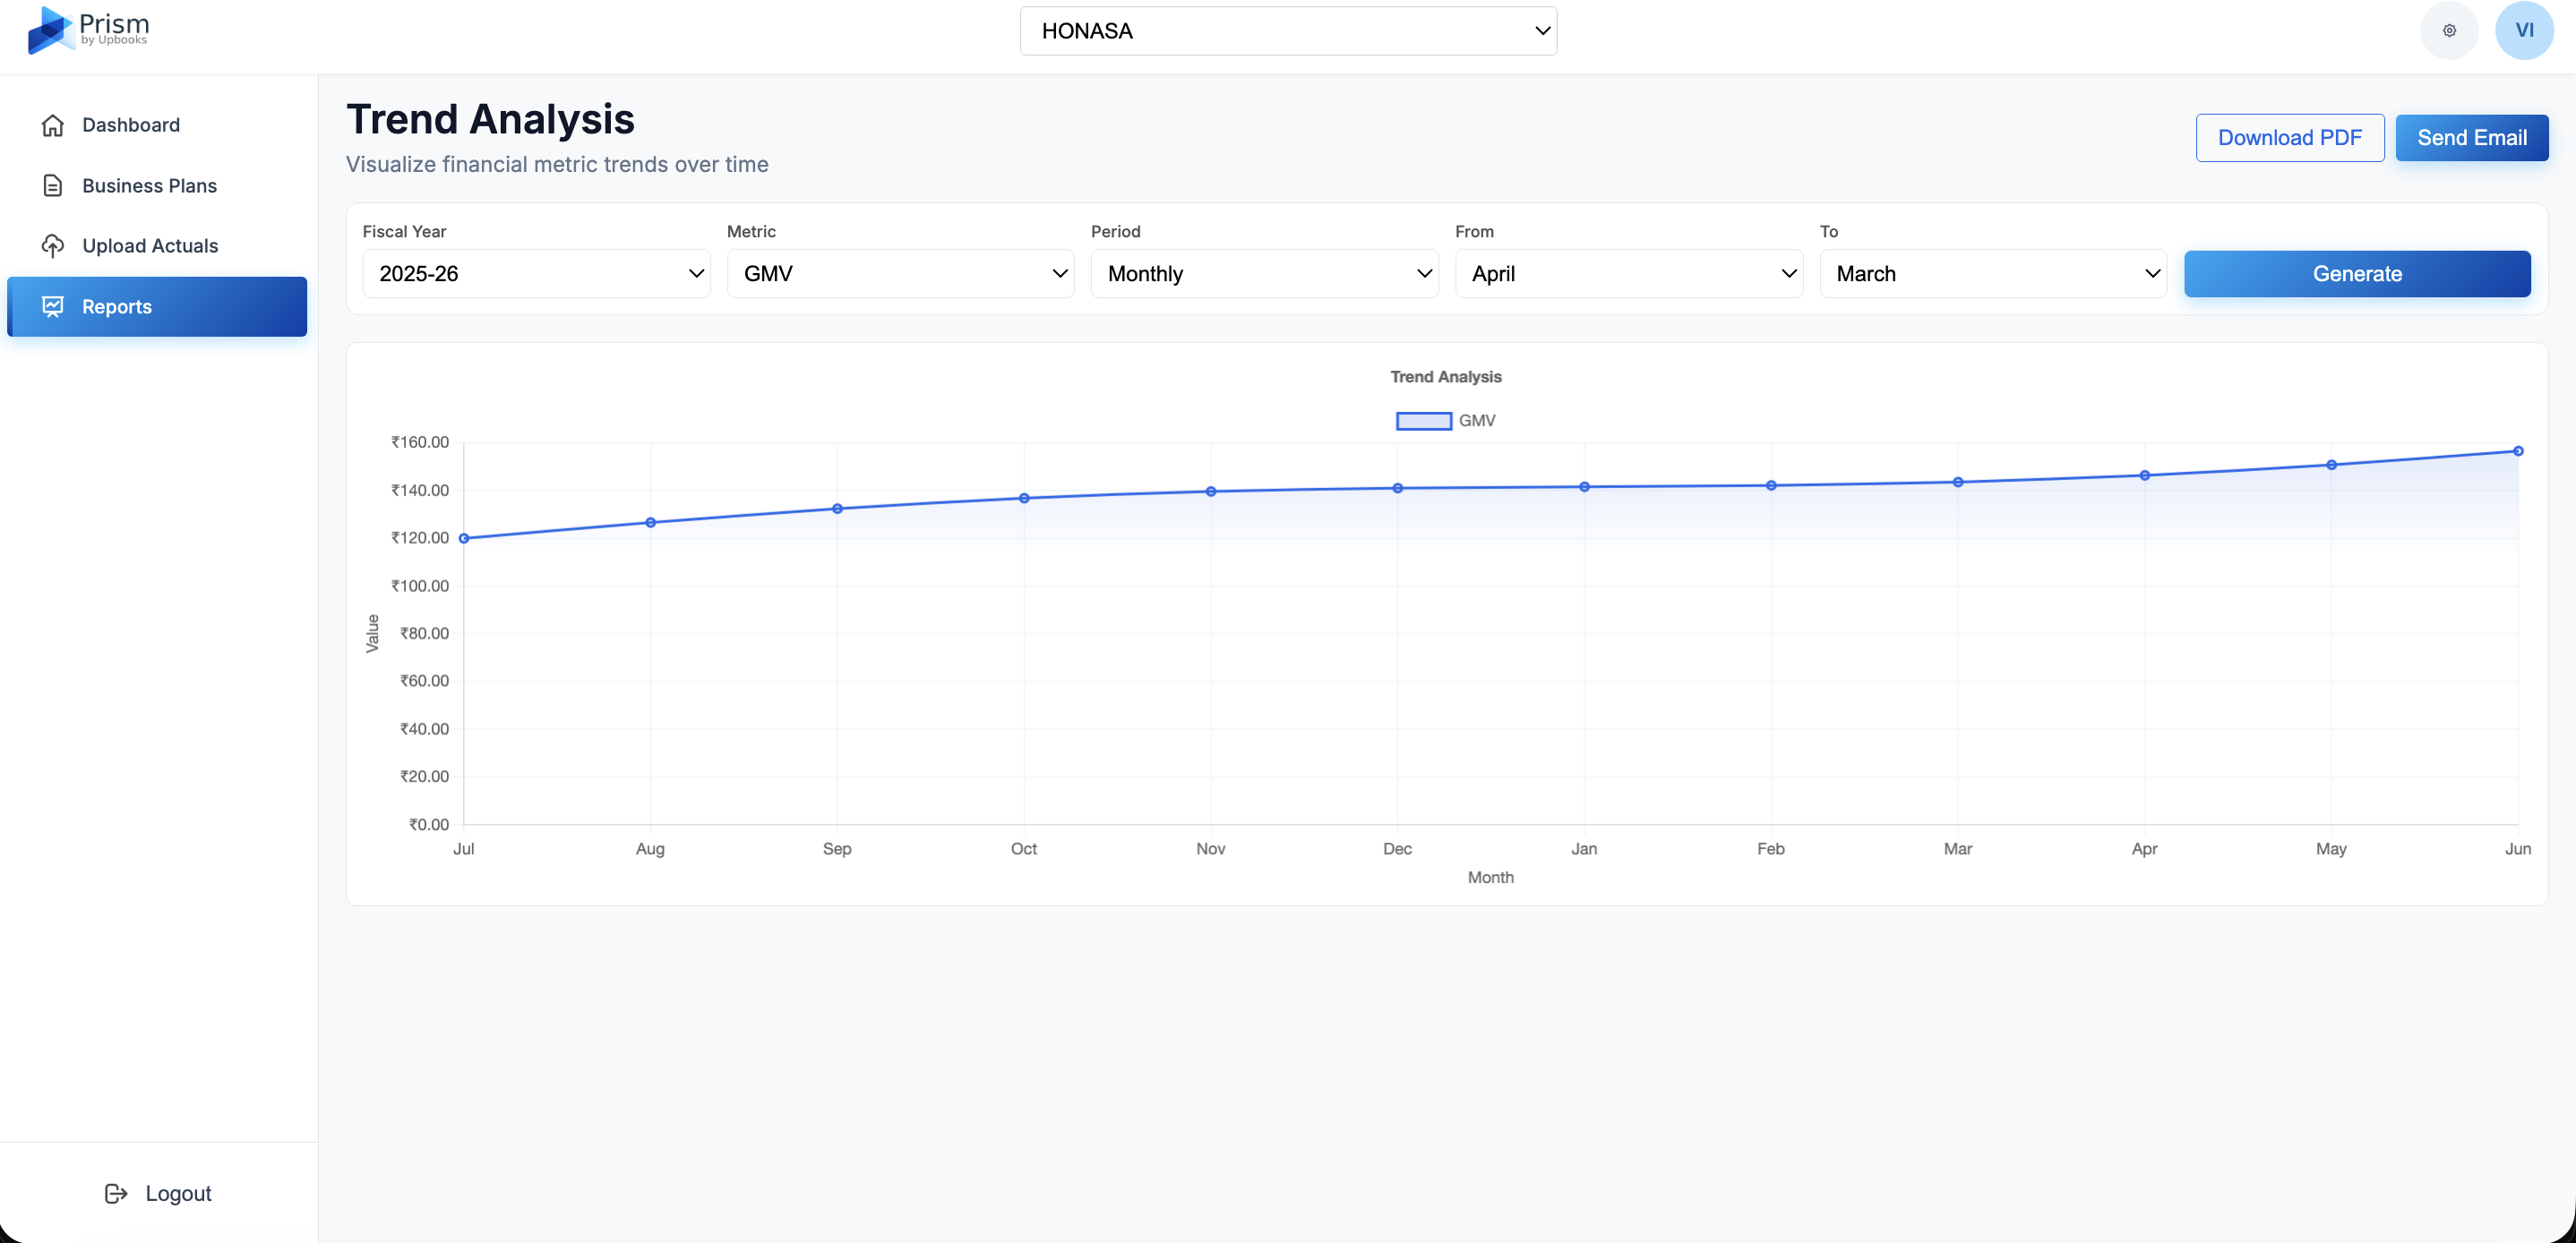
Trend Analysis
What it does: Charts showing how financial metrics change over time.
- Spot patterns – See whether revenue, costs, or profits are trending up or down
- Time range – Pick any range of months or quarters
- By metric – Focus on specific metrics (e.g. revenue, gross margin)
- Export and share – Download as PDF or email for stakeholders
Benefits for your business
Spot trends and patterns to guide planning and strategy.
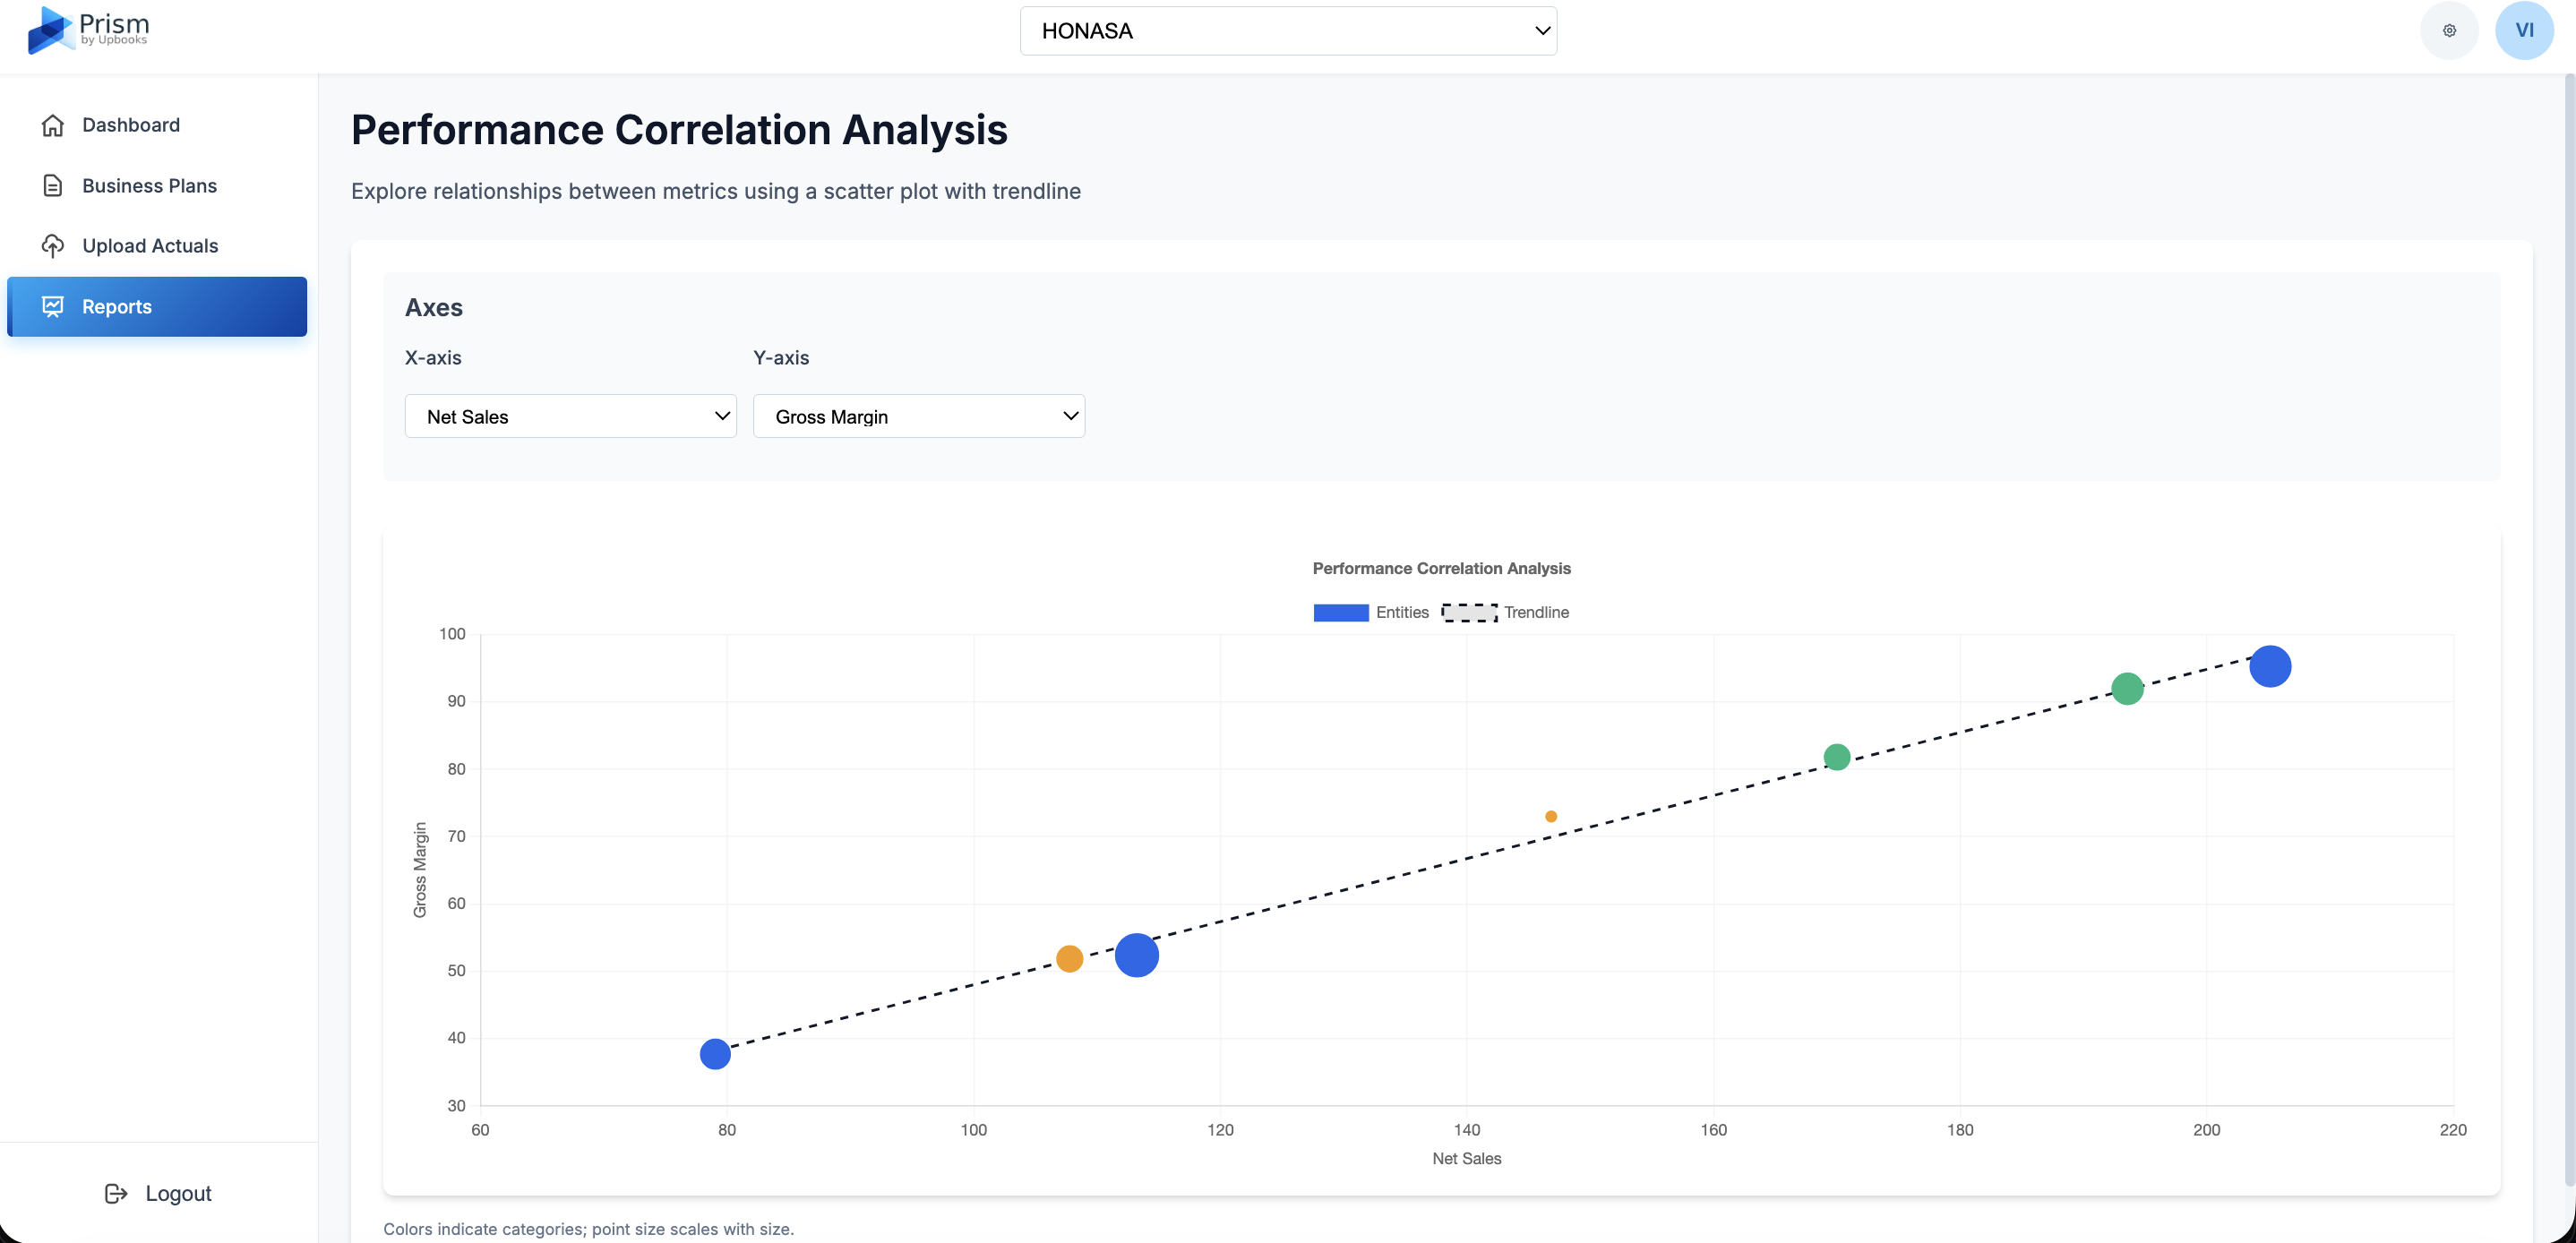
Performance Correlation Analysis
What it does: Shows how two metrics relate to each other (e.g. marketing spend vs revenue).
- Understand relationships – See if one metric affects another
- Back decisions with data – Use the analysis to support investment or cost decisions
- Explore cause and effect – Test hypotheses like "does more spend lead to more revenue?"
Benefits for your business
Use data to make better investment and cost decisions.
Build a financial function that leads the company.
Replace spreadsheets with a live FP&A engine built on real operational data.
Enterprise
For large organizations
Talk to our team for a tailored plan
Contact Sales